


What the 4.29 Percentage Point Drop Reveals About Fluid’s Market Position

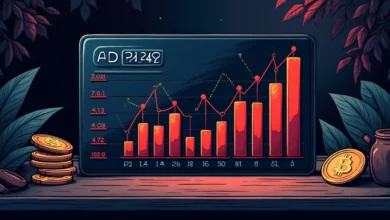
Fluid USDC supply APY fell from 9.84% to 5.55% in one week during September 2026. That 4.29 percentage point collapse exceeded normal volatility by a factor of sixteen. Over the prior 30 days, Fluid USDC rates averaged 5.03% with measured volatility of ±0.27 percentage points. A move this large does not happen from routine market noise.
As of October 6, 2026, Fluid USDC on Ethereum paid 4.83% APY with $130 million in TVL, down from its September average of 5.2% base rate. The protocol held $918 million in total value locked across Ethereum, Arbitrum, Base, and Polygon, with USDC representing a significant portion of its lending capacity. The rate compression happened at a moment when Fluid’s lending TVL grew 6.8% over the trailing 30 days, which means falling rates coincided with rising capital, not a liquidity drain.
This pattern matters because it distinguishes two failure modes: utilization-driven collapse versus governance-imposed rebalancing. In the first case, borrow demand evaporates and rates fall mechanically. In the second case, the protocol adjusts reserve factors, incentive allocations, or liquidity caps to manage systemic risk. The economic outcome for a lender is the same in both scenarios – lower yield – but the signal is different. One suggests temporary market rebalancing. The other suggests structural yield degradation that will persist until governance votes to reverse it.
The decision tree starts with this question: did Fluid’s borrow APY collapse alongside supply APY, or did the spread widen? If borrow rates fell proportionally, the issue is utilization. If borrow rates stayed elevated while supply rates compressed, the protocol increased its reserve factor or reduced incentive distribution. You need to monitor both sides of the market to understand which mechanism triggered the drop.
How to Distinguish Utilization Collapse From Parameter Adjustment

Start with the borrow-supply spread. Fluid operates a two-sided lending market where depositors earn the base interest rate paid by borrowers, minus a protocol reserve factor. When utilization drops – the percentage of supplied capital that is actively borrowed – both borrow and supply rates fall together because fewer borrowers are competing for liquidity. When the reserve factor increases, supply rates fall while borrow rates hold steady or rise, because the protocol is taking a larger cut of the spread.
Check DeFiLlama’s historical APY chart for Fluid USDC. If the borrow APY curve tracks the supply APY curve downward during the same week, the collapse is utilization-driven. This is a temporary market condition: borrow demand fluctuates with broader crypto market sentiment, leverage appetite, and competing protocol rates. When sentiment recovers, utilization rises and rates follow. The timeframe for recovery depends on market structure, but utilization-driven drops typically reverse within two to six weeks unless a macro catalyst persists.
If the borrow APY stayed flat or rose while supply APY fell, you are looking at a parameter change. This happens when governance votes to increase the reserve factor, reduce INST token incentive distribution, or adjust the interest rate curve slope. These changes are intentional and persistent. They reverse only when governance votes again, which depends on treasury health, protocol revenue targets, and competitive positioning decisions that operate on quarterly or longer timeframes.
The May 2026 Resolv depeg event provides context here. That incident resulted in $21 million in losses, with Fluid governance absorbing $8.2 million from the protocol treasury. Treasury depletion creates pressure to increase reserve factors and tighten incentive budgets. If you see governance forum discussions referencing treasury replenishment or conservative risk management in the weeks before the rate drop, that is confirmation the drop was parameter-driven, not market-driven.
How Fluid’s Dual-Utilization Model Affects Your Effective Yield
Fluid differs from Aave and Compound because deposited capital serves two functions simultaneously: lending to borrowers and providing liquidity for DEX swaps. Each utilization stream pays the depositor separately. Lending interest accrues per second based on borrow demand. DEX swap fees accrue per swap based on trading volume. Your effective APY is the sum of both streams, weighted by what fraction of your capital is active in each use at any moment.
This creates a measurement problem. When you see a 4.29 percentage point drop in “USDC supply APY” on a dashboard, you are usually seeing only the lending component. The DEX fee component may still be earning 2-3 percentage points depending on swap volume. If you rely solely on the headline lending APY figure to make exit decisions, you are overstating the economic loss.
To measure your actual yield, you need to track both components separately. DeFiLlama and Fluid’s native dashboard show combined APY figures, but they do not always break out the DEX fee contribution. If the protocol publishes swap volume metrics or fee revenue data, you can back into the DEX yield by subtracting the displayed lending APY from your wallet’s actual accrued interest over a seven-day window. This gives you a real-time picture of whether the drop affects only the lending side or both revenue streams.
In practice, DEX fees are more volatile than lending rates because they depend on concentrated liquidity ranges and trading volume spikes. During low-volatility periods, DEX fees compress toward zero and your yield becomes purely lending-driven. During high-volatility weeks, DEX fees can contribute 3-5 percentage points and mask lending rate compression. The Uniswap V3 WETH yields spike 15pp during volatility for the same reason: fee income scales with volume and price movement, not with static borrow demand.
What Competitor Rates Signal About Relative Positioning
Fluid competes on yield premium. The protocol’s architecture concentrates borrow demand into specific markets through Smart Collateral and Smart Debt mechanisms, which allow higher capital efficiency than Aave’s isolated pools. In May 2026, Fluid offered 5.5-9.2% on USDC supply while Aave V3 ranged 3.8-6.2% and Morpho Blue ranged 4.0-8.5%. That premium justified Fluid’s higher smart contract risk and lower liquidity.
As of October 6, 2026, that premium inverted. Fluid USDC paid 4.83% while Maple syrupUSDC paid 5.18% and Aave V3 paid 4.60%. If you account for Fluid’s dual-utilization DEX fees, the protocols are roughly at parity, which eliminates Fluid’s primary value proposition. When risk-adjusted returns equalize, capital flows to the protocol with the deepest liquidity and longest track record. Aave holds $11 billion in TVL. Fluid holds $918 million. The liquidity depth advantage favors Aave in a rate-parity environment.
Track whether capital is migrating out of Fluid toward higher-yielding alternatives. If Fluid’s USDC TVL falls by 20% or more in the two weeks following the rate drop, that confirms the market views the drop as structural degradation rather than temporary rebalancing. If TVL holds steady or grows, the market is pricing in a utilization recovery and capital is staying put despite the lower headline rate.
The most relevant comparison is to Morpho Blue and Jupiter Lend. Morpho Blue vaults deliver 4-8.5% on USDC with aggressive curator strategies, and Jupiter Lend pays about 9.4% base interest on Solana with no token rewards. Both protocols operate with higher utilization concentration than Aave, which makes them the natural competitive set for Fluid. If Morpho or Jupiter rates rise while Fluid rates fall, and if you see wallet tracking data showing capital outflows from Fluid to those protocols, that is confirmation of competitive yield degradation.
You can monitor this with on-chain flow data from Nansen or Dune Analytics. Filter for USDC withdrawals from Fluid’s Ethereum lending contract in the seven days following the rate drop, then cross-reference deposit flows into Morpho Blue vaults and Aave V3 USDC markets during the same period. A net outflow exceeding 15% of Fluid’s USDC TVL is a material signal that the market expects the rate compression to persist.
Exit Criteria: When a 4pp Drop Signals Structural Degradation
Set a monitoring window of 14 days from the initial rate drop. During that window, track four metrics: utilization rate, TVL trend, borrow APY, and competitor rate spreads. If three or more of the following conditions hold at the end of the window, exit the position and reallocate to a higher-yielding alternative.
First, utilization falls below 30% and stays there for more than ten consecutive days. Fluid’s utilization rate directly drives lending APY through the protocol’s interest rate curve. When utilization drops from 43% to below 30%, the curve’s slope pushes rates into the lower bound of the acceptable range. If utilization does not recover within two weeks, the drop is not a temporary demand shock. It reflects a shift in borrower preference away from Fluid, either because competing protocols offer better borrow terms or because the collateral assets Fluid supports have fallen out of favor.
Second, Fluid’s USDC TVL declines by more than 20% over the 14-day window. TVL growth of 6.8% over 30 days suggests the protocol was attracting capital before the rate drop. If that trend reverses and TVL falls sharply, it means lenders are exiting faster than new capital is entering. This creates a feedback loop: falling TVL reduces liquidity depth, which increases slippage for large withdrawals, which accelerates further outflows. The protocol can stabilize by raising rates, but if governance does not act within two weeks, the degradation is structural.
Third, the spread between Fluid’s supply APY and the highest competitor rate exceeds 2 percentage points for more than seven consecutive days. As of October 6, Maple syrupUSDC paid 5.18% and Fluid paid 4.83%, a spread of 0.35 percentage points. If that spread widens to 2 percentage points or more – for example, if Morpho Blue vaults raise rates to 7% while Fluid holds at 4.8% – the opportunity cost of staying in Fluid is $2,730 per year on a $300,000 position. That cost justifies the gas fees and withdrawal friction required to migrate capital.
Fourth, governance forum activity shows no discussion of rate curve adjustments, incentive increases, or reserve factor reductions within 14 days of the drop. If governance is silent, the rate drop was either unintentional and unnoticed, or intentional and accepted as the new equilibrium. Either scenario suggests rates will not recover without external pressure. Check Fluid’s governance forum for proposals tagged with “interest rate model,” “reserve factor,” or “incentive allocation.” If no proposals appear within two weeks, governance has implicitly accepted the new rate structure.
For context on how other protocols handle similar drops, reference the Curve crvUSD-WBTC APY collapse of 9.69 points in one week. That drop reflected gauge weight reallocation, a governance-driven parameter change. Curve’s governance responded within 12 days by redistributing incentives to stabilize the affected pool. If Fluid governance does not respond with similar urgency, the protocol is accepting lower rates as the new baseline.
What to Do Next: Reallocation Strategy and Monitoring Protocol
If you determine the rate drop is temporary and utilization-driven, stay in the position and monitor utilization daily using DeFiLlama’s Fluid protocol page. Set a calendar reminder to check the utilization rate every 72 hours. If utilization recovers to 40% or higher within 14 days, rates will follow within one to two weeks as the interest rate curve responds to increased borrow demand.
If you determine the rate drop is structural and parameter-driven, initiate withdrawal and reallocate to the highest risk-adjusted alternative. As of October 2026, the reallocation priority order based on risk-adjusted yield is: Maple syrupUSDC at 5.18% on $2.8 billion TVL, then Aave V3 USDC at 4.60% on multi-billion dollar liquidity, then Morpho Blue curator vaults offering 4-8.5% with higher curator risk. Avoid Jupiter Lend’s 9.4% unless you are comfortable with Solana ecosystem risk and cross-chain bridging costs, which can eliminate the yield advantage for positions under $100,000.
Track ongoing rate trends using a crypto yield calculator to compare net returns after gas fees. If you are withdrawing $300,000 from Fluid on Ethereum, expect $40-80 in gas fees depending on network congestion. Reallocating to Aave or Morpho on the same chain adds another $40-80 in deposit gas. Total migration cost is $80-160, which is recouped in 11 days if you move from 4.83% to 5.18%, or in 6 days if you move to a Morpho vault paying 7%.
For positions under $50,000, consider whether the migration cost justifies the yield improvement. A 0.35 percentage point spread on $50,000 is $175 per year, or $14.58 per month. If migration costs $120 in gas, you break even in eight months. This makes migration uneconomical unless the spread widens to 1 percentage point or more, which would recoup costs in four months.
Set up rate alerts using DeFiLlama’s notification system or a custom Dune Analytics dashboard. Configure alerts to trigger when Fluid USDC supply APY falls below 4.5%, when competitor rates rise above 6%, or when the spread between Fluid and the highest alternative exceeds 1.5 percentage points. These thresholds give you early warning of competitive degradation before the opportunity cost accumulates to material levels.
For broader context on how to evaluate DeFi lending protocols systematically, review best DeFi protocols by category covering lending, DEXs, and yield aggregators with TVL data and yield source comparisons. That framework helps you assess whether Fluid’s rate compression is an isolated event or part of a broader shift in DeFi lending economics across multiple protocols.
The Takeaway
A 4.29 percentage point drop in one week exceeds normal volatility by a factor of sixteen. You distinguish temporary rebalancing from structural degradation by monitoring four signals: borrow APY movement, utilization trend, TVL trajectory, and governance response. If utilization recovers above 40% within 14 days, the drop is temporary. If TVL falls 20% and governance stays silent, the drop is structural. The exit threshold is a 2 percentage point spread to competitors held for seven days, which costs $2,730 annually on $300,000 and justifies migration despite gas fees. That decision framework prevents staying in a degrading position when Maple now pays 5.18% and Morpho vaults offer 4-8.5% with comparable risk profiles.
Frequently Asked Questions
What caused Fluid USDC APY to drop 4.29 percentage points in one week?
The drop resulted from either falling borrow utilization or a governance-imposed parameter change. If Fluid’s borrow APY fell proportionally with supply APY during the same period, the cause is reduced borrow demand and lower utilization. If borrow rates stayed elevated while supply rates compressed, governance increased the reserve factor or reduced INST incentive distribution. Check DeFiLlama’s historical APY charts for both borrow and supply rates to distinguish between the two mechanisms.
How do I know if the rate drop is temporary or permanent?
Monitor utilization rate, TVL trend, and governance forum activity over 14 days. If utilization recovers above 40% within two weeks, the drop is temporary and rates will follow the interest rate curve back up. If TVL falls more than 20% and governance posts no proposals to adjust rate parameters, the drop reflects a new structural equilibrium. Temporary drops reverse in two to six weeks; structural changes persist until governance votes to reverse them.
Should I exit Fluid when competitor rates are higher?
Exit when the spread to the highest competitor exceeds 2 percentage points for seven consecutive days and migration costs are justified by the yield improvement. On a $300,000 position, a 2 percentage point spread costs $6,000 annually, which justifies $80-160 in gas fees to migrate. For positions under $50,000, wait for a 1 percentage point spread to ensure migration costs are recouped within four months. Set rate alerts to trigger when spreads cross these thresholds.
How does Fluid’s dual-utilization model affect my actual yield?
Fluid deposits earn both lending interest from borrowers and DEX swap fees from traders. When you see a supply APY drop on a dashboard, it usually shows only the lending component. DEX fees may still contribute 2-3 percentage points depending on swap volume. To measure actual yield, track your wallet’s total accrued interest over seven days and subtract the displayed lending APY. This reveals the DEX fee contribution and prevents overstating your economic loss during rate drops.
What are the exit criteria when Fluid rates fall sharply?
Exit if three of these four conditions hold after 14 days: utilization below 30% for ten consecutive days, TVL decline exceeding 20%, spread to competitors above 2 percentage points for seven days, or no governance proposals addressing rate adjustments within two weeks. These signals indicate structural degradation rather than temporary rebalancing. Reallocate to Maple syrupUSDC at 5.18%, Aave V3 at 4.60%, or Morpho Blue vaults offering 4-8.5% depending on your risk tolerance and position size.
The Weekly Yield Report
You just analyzed four signals distinguishing temporary utilization drops from structural parameter degradation. Those signals will change as protocols adjust to competitive pressure.
Every Thursday: where crypto yield actually is – stablecoins, liquid staking and DeFi lending, with the risk named next to the rate and what changed since last week.
Free. No trade calls, no allocations, no hype. Unsubscribe in one
click.
Source link