


The Question That Should Be Asked Before Every Low-Cap Entry

A token trades at $0.50. Its market capitalization stands at $30 million. The pitch is compelling, the roadmap credible, the team experienced. You enter the position. Six months later the project has grown revenue by 40%, gained meaningful partnerships, and delivered two major protocol upgrades. The token trades at $0.32. You are down 36% on a thesis that proved correct.
What happened is not a mystery. The circulating supply grew from 60 million tokens to 400 million tokens. The fully diluted valuation was $300 million at the time you entered, a fact disclosed on every data aggregator but ignored in the analysis. The market capitalization stayed flat while circulating supply increased by 567%. Your position was diluted, not disproven. This is the most common loss mechanism in small-cap crypto, and it is entirely predictable if you price the unlock schedule into the entry decision rather than reacting to it afterward.
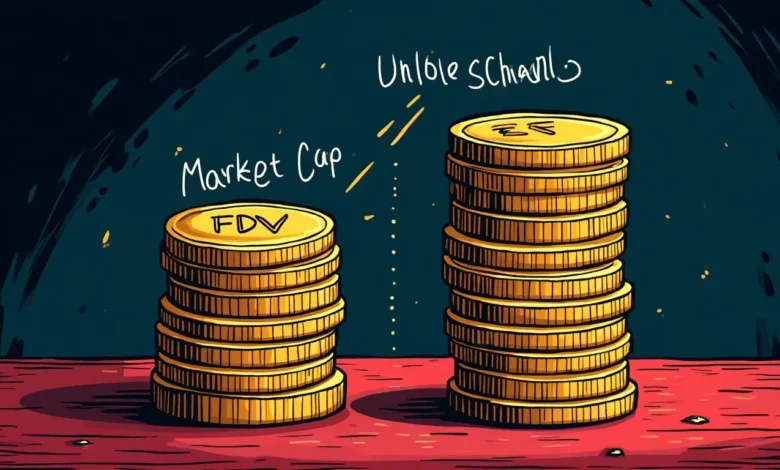
Market cap measures only the tokens already circulating. Fully diluted valuation measures what the entire supply would be worth at the current price, including every token still locked in team wallets, treasury reserves, and vesting schedules. The gap between the two is a warning about how much supply is waiting to hit the market. Where that gap is wide, dilution is structural, not accidental. The token does not need to fail for you to lose money. It merely needs to release the supply it always planned to release.
How Market Cap and FDV Are Calculated

The formulas are simple. Market capitalization is the current token price multiplied by the circulating supply, which is the number of tokens available to trade right now. Fully diluted valuation is the same token price multiplied by the total supply, which includes every token that will ever exist under the current issuance schedule. If a token trades at $2.00 and has 50 million tokens circulating with a total supply of 500 million, the market cap is $100 million and the FDV is $1 billion. The ratio between the two is 0.1, meaning 90% of the supply has not yet entered circulation.
CoinGecko displays this ratio on every token page under the “Market Cap / FDV” field. A ratio of 1.0 means the entire supply is circulating and no further dilution is scheduled. A ratio of 0.5 means half the supply is still locked. A ratio of 0.1 means the circulating supply will need to grow tenfold to reach full dilution, and unless demand grows proportionally, the price will compress to absorb that supply. Most retail losses in tokens under $100 million market cap come from ratios below 0.3, where the unlock schedule was disclosed but not priced into the position sizing or holding period.
Worldcoin showed a market cap near $1.54 billion against an FDV of $4.25 billion in August 2024, producing a ratio of 0.36. This meant that even if the project succeeded in every technical and adoption goal, the token price would need to absorb a threefold increase in circulating supply over the vesting period. The price could fall 50% while the project grew 200%, purely as a function of supply expansion. This is not bearish sentiment. It is arithmetic.
Why Token Unlocks Produce Predictable Losses
Research covering more than 16,000 token unlock events found that approximately 90% created negative price pressure regardless of size, timing, or recipient category. This is not because recipients always sell. It is because the market front-runs the event. Traders initiate selling pressure nearly 30 days before the actual unlock, anticipating that some portion of newly liquid tokens will be sold and that price will adjust downward to clear that supply. The unlock itself is often the moment of maximum fear, but the price damage begins weeks earlier.
Cliff unlocks, where a large percentage of supply becomes liquid on a single date, produce immediate volatility. Linear vesting, where tokens unlock gradually over months or years, produces a slower bleed that is harder to time but compounds steadily. A typical team vesting schedule includes a 12-month cliff with 25% of allocation unlocking on that date, followed by linear monthly releases over 36 months. The cliff represents the maximum single-day dilution risk. The linear tail represents the ongoing supply pressure that continues regardless of market conditions.
Arbitrum’s March 2024 unlock increased circulating supply by 87% in a single event. The token dropped more than 12% despite strong fundamentals, institutional backing, and growing protocol usage. The unlock was scheduled, disclosed, and entirely predictable. The price moved because the supply moved, and the market repriced the token to reflect the new equilibrium between available supply and current demand. This was not a failure of the project. It was the market pricing in dilution that had always been part of the tokenomics design.
When an unlock exceeds 5% of circulating supply, material price impact is likely. When it exceeds 20%, severe downward pressure is nearly guaranteed. The mechanism is straightforward. If circulating supply increases by 20% and market capitalization remains constant, the price must fall by approximately 16.7% simply to maintain the same aggregate valuation. For that price to stay flat, demand must absorb the entire new supply at the prior price level. In most cases, it does not.
The Case Where Unlocks Do Not Crash the Price
An unlock schedule does not automatically produce a price decline. Three conditions can prevent it. First, the unlocked tokens must have immediate utility that discourages selling. Tokens that can be staked for yield, used in governance, or locked for fee-sharing are less likely to be dumped on the open market. LayerZero and Lista DAO both experienced large unlocks where significant portions of newly liquid tokens were immediately restaked rather than sold, absorbing the supply internally rather than pushing it to exchanges.
Second, the market environment matters. A token unlocking supply during a bull market, where aggregate liquidity is expanding and attention is high, absorbs new supply more easily than one unlocking during a bear market where liquidity is thin and bids are shallow. The same unlock event in different macro conditions produces different price outcomes, though the structural dilution is identical in both.
Third, the project’s fundamental growth rate must exceed the dilution rate. If circulating supply grows 50% over 12 months but revenue grows 150%, the market may reprice the token upward despite dilution. This is rare in small-cap tokens, where unlock schedules are typically faster than revenue realization, but it is the only sustainable path for a token to appreciate through a heavy vesting schedule. You can find examples of this behavior in low-cap versus large-cap risk comparisons, where mature tokens with high circulating ratios behave differently under supply pressure than those still early in their vesting cycles.
Worked Example: $30 Million Market Cap, $300 Million FDV
A token trades at $0.50 with 60 million circulating and 600 million total supply. Market cap is $30 million. FDV is $300 million. The ratio is 0.1. Over the next 24 months, 540 million tokens will unlock linearly, increasing circulating supply from 60 million to 600 million. Assume market capitalization stays flat at $30 million, meaning aggregate demand neither grows nor shrinks.
At full dilution, if market cap remains $30 million and circulating supply reaches 600 million, the token price will be $0.05. You entered at $0.50. Your position has lost 90% not because the project failed but because the supply expanded tenfold while demand stayed constant. Even if the project grew revenue by 50% during that period, the token price fell 90% because the dilution rate far exceeded the demand growth rate. This is the default outcome for most tokens with FDV ratios below 0.2, and it is why filtering by that ratio is one of the most effective risk controls available.
If instead the project’s market cap doubles to $60 million by the time full dilution is reached, the token price will be $0.10. You are still down 80%. For the token to return to your $0.50 entry price at full dilution, the market cap must grow to $300 million, a tenfold increase in aggregate valuation. That is possible if the project becomes a category leader, but it is not the base case. Pricing a position in a 0.1 FDV ratio token means pricing in either a tenfold market cap expansion or a 90% price decline. Most investors price in neither and are surprised when the latter occurs.
Where to Track Unlock Schedules and What to Look For
CoinGecko’s tokenomics page for each asset displays the vesting schedule, allocation breakdown, and upcoming unlock dates. Tokenomist.ai provides a calendar view of major unlocks across hundreds of projects, with details on cliff versus linear releases. Token Unlocks (datawallet.com) specializes in tracking supply shock events, flagging unlocks that exceed 5% of circulating supply in a single release.
The most important data points are the unlock percentage relative to current circulating supply, the date of the next cliff event, and the monthly linear release rate if applicable. A token with 80% of supply already circulating and a 2% monthly release rate poses minimal dilution risk. A token with 15% circulating and a 50% cliff unlock in 60 days poses extreme dilution risk. The structure of the vesting schedule tells you whether the risk is concentrated in a single event or distributed over time.
For any position in a token with an FDV ratio below 0.5, the unlock schedule should be treated as a primary risk factor, equivalent in weight to liquidity depth and competitive positioning. Where unlocks are front-loaded and near-term, the position sizing should reflect the high probability of price compression before the thesis has time to prove out. Where unlocks are back-loaded and the project has 18 to 24 months to deliver revenue or usage growth, the risk is more manageable, though still structural.
Cross-referencing unlock timing with liquidity depth in low-cap tokens provides a clearer picture of exit conditions. A token unlocking 30% of circulating supply into a market with $50,000 daily volume will experience more severe price impact than one unlocking the same percentage into $2 million daily volume. Liquidity absorbs or amplifies the dilution effect, and both must be measured together.
When FDV Matters and When It Does Not
FDV matters most in tokens with vesting schedules longer than 24 months and FDV ratios below 0.3. These are the conditions under which dilution becomes the dominant price driver, often overwhelming fundamental performance. It matters less in tokens with ratios above 0.8, where most supply is already circulating and the remaining unlock schedule is back-loaded or spread over many years. A token with 85% of supply circulating and a 1% monthly release rate will experience dilution, but that dilution is slow enough that demand growth can offset it if the project performs.
FDV also matters less in tokens where the unlocked supply has strong utility. Ethereum’s transition to proof-of-stake made staking the dominant use case for ETH, meaning that new issuance was largely absorbed into staking rather than sold. Tokens with governance power, fee-sharing mechanisms, or liquidity mining incentives that reward locking rather than selling experience less price pressure from unlocks because the newly liquid supply does not immediately flow to exchanges.
Where FDV does not matter is in tokens that are already fully diluted or close to it. Bitcoin’s issuance schedule is fixed and transparent, with over 93% of total supply already mined. The remaining issuance is slow and predictable, declining by half every four years. No unlock event will surprise the market because the supply curve is known decades in advance. This is why market cap levels in crypto treat Bitcoin as a special case where FDV and market cap converge, removing dilution as a structural risk factor.
The Risk Framework You Should Apply
If a token’s FDV ratio is below 0.3, assume dilution will dominate price action for the next 12 to 24 months unless the project achieves exceptional demand growth. Position sizing should reflect that assumption. A 2% portfolio allocation to a 0.1 FDV ratio token is defensible if the thesis is strong and liquidity is adequate. A 10% allocation to the same token is pricing in a tenfold market cap expansion, which is not a base case for most projects.
If a single unlock event will increase circulating supply by more than 10%, expect front-running to begin 30 days before the event and price pressure to persist for 7 to 14 days afterward. This is the window in which traders who are aware of the schedule will derisk or short, and it is the window in which unaware holders experience the largest drawdowns. Monitoring unlock calendars and setting alerts for major events provides an edge simply by removing surprise.
If a token’s vesting schedule includes a cliff event within the next 90 days and you are holding for fundamental reasons, consider whether the thesis will have time to prove out before the cliff hits. If the unlock arrives before the next major product release, partnership announcement, or revenue milestone, the dilution will arrive before the demand catalyst, and the price will likely compress. Timing entries after cliff events rather than before them removes the front-running risk and often provides better entry prices as the market digests the new supply.
The Takeaway
A token trading at $30 million market cap with $300 million FDV is not the same bet as one where the two figures are close. The first is a bet that demand will grow tenfold before supply does. The second is a bet on a project with minimal dilution risk. Most retail losses in small-cap tokens come not from failed projects but from supply schedules that were disclosed, ignored, and then experienced as unexpected price declines. The market cap to FDV ratio is the single most predictive filter for avoiding those losses. Where the ratio is below 0.3, dilution is structural. Where it is above 0.8, the risk is manageable. Pricing future supply into the entry decision rather than reacting to it after the unlock turns a common loss mechanism into an avoidable one.
Frequently Asked Questions
What is the difference between market cap and fully diluted valuation in crypto?
Market cap is calculated by multiplying a token’s current price by its circulating supply, which is the number of tokens available to trade right now. Fully diluted valuation uses the same token price but multiplies it by the total supply, including all tokens still locked in vesting schedules, team allocations, or treasury reserves. The gap between the two reveals how much supply dilution is waiting to enter the market. A token with $30 million market cap and $300 million FDV has 90% of its supply still locked, meaning holders face significant dilution risk as those tokens unlock.
Why do token unlocks usually cause price drops?
Research on over 16,000 unlock events found that approximately 90% create negative price pressure, primarily because the market front-runs the event. Traders begin selling 30 days before scheduled unlocks, anticipating that some portion of newly liquid tokens will be sold. When circulating supply increases by 5% or more in a single unlock, material price impact is likely. When it exceeds 20%, severe downward pressure is nearly guaranteed. Even if recipients do not sell immediately, the market reprices the token to reflect the increased supply. If market cap stays flat while circulating supply grows 50%, the token price must fall roughly 33% to maintain the same aggregate valuation.
How can I find out when a token’s supply will unlock?
CoinGecko displays vesting schedules, allocation breakdowns, and the market cap to FDV ratio on each token’s page. Tokenomist.ai provides a calendar view of upcoming unlocks across hundreds of projects, distinguishing between cliff events and linear releases. Token Unlocks via datawallet.com specializes in tracking supply shock events and flags unlocks exceeding 5% of circulating supply. For the most authoritative data, check the project’s whitepaper or GitHub repository, which typically includes the full tokenomics schedule. Monitoring these sources and setting alerts for major unlock dates provides an edge by removing surprise from the dilution timeline.
What is a good market cap to FDV ratio?
A ratio of 1.0 means the entire supply is circulating and no further dilution is scheduled, representing minimal risk. A ratio between 0.5 and 0.8 indicates moderate dilution risk, typical for established projects with standard four-year vesting. A ratio below 0.3 signals extreme dilution risk, where circulating supply will more than triple before full dilution is reached. Most retail losses in tokens under $100 million market cap come from ratios below 0.3, where the unlock schedule was disclosed but not priced into position sizing. Filtering for tokens with ratios above 0.5 removes the highest-dilution projects from consideration.
Can a token price go up even with large unlocks scheduled?
Yes, if three conditions are met. First, the unlocked tokens must have strong utility that discourages selling, such as staking for yield, governance rights, or fee-sharing mechanisms. Second, the market environment must be favorable, with expanding liquidity and attention during a bull market absorbing new supply more easily. Third, the project’s fundamental growth rate must exceed the dilution rate. If circulating supply grows 50% but revenue grows 150%, the market may reprice the token upward despite dilution. This is rare in small-cap tokens but possible when demand catalysts arrive before or during major unlock events.
The Weekly Yield Report
You now understand how to calculate dilution risk using market cap to FDV ratios and unlock schedules. Those ratios and schedules change every quarter as new tokens vest.
Every Thursday: where crypto yield actually is – stablecoins, liquid staking and DeFi lending, with the risk named next to the rate and what changed since last week.
Free. No trade calls, no allocations, no hype. Unsubscribe in one
click.
Source link