

Why Raw Holder Rankings Are Misleading

The ‘Top Holders’ list on Etherscan or Solscan is not a list of who can exit into your liquidity. It is a list of addresses, many of which represent exchange custody infrastructure, liquidity pool contracts, protocol treasuries, and vesting locks. When you see that the top ten addresses control 62% of circulating supply, that number is analytically useless until you know how many of those addresses are Binance hot wallets, how many are Uniswap liquidity pairs, and how many are actual holders who can sell tomorrow.
The distinction matters for a specific reason. Every yield opportunity in crypto carries counterparty risk, but token concentration risk is the version where a handful of wallets can exit before you do, turning your position into exit liquidity regardless of your thesis. The top-holder percentage is the metric that tells you whether that risk is acceptable, but only after you exclude the addresses that represent infrastructure rather than ownership.
Research into concentration metrics shows that excluding protocol-controlled addresses changes the Herfindahl-Hirschman Index by a median factor of 2.3 times, with some tokens showing an 18-times difference when custodial bridge contracts are removed from the calculation. This is not a rounding error. This is the difference between a token that looks dangerously concentrated and one that has a plausible claim to distributed ownership.
What follows is the process for distinguishing exchange and contract wallets from real holders, calculating the concentration percentage that actually matters, and deciding what threshold makes a position untenable. This is not complicated, but it is manual, and most holders never do it.
Reading The Holder List On Etherscan
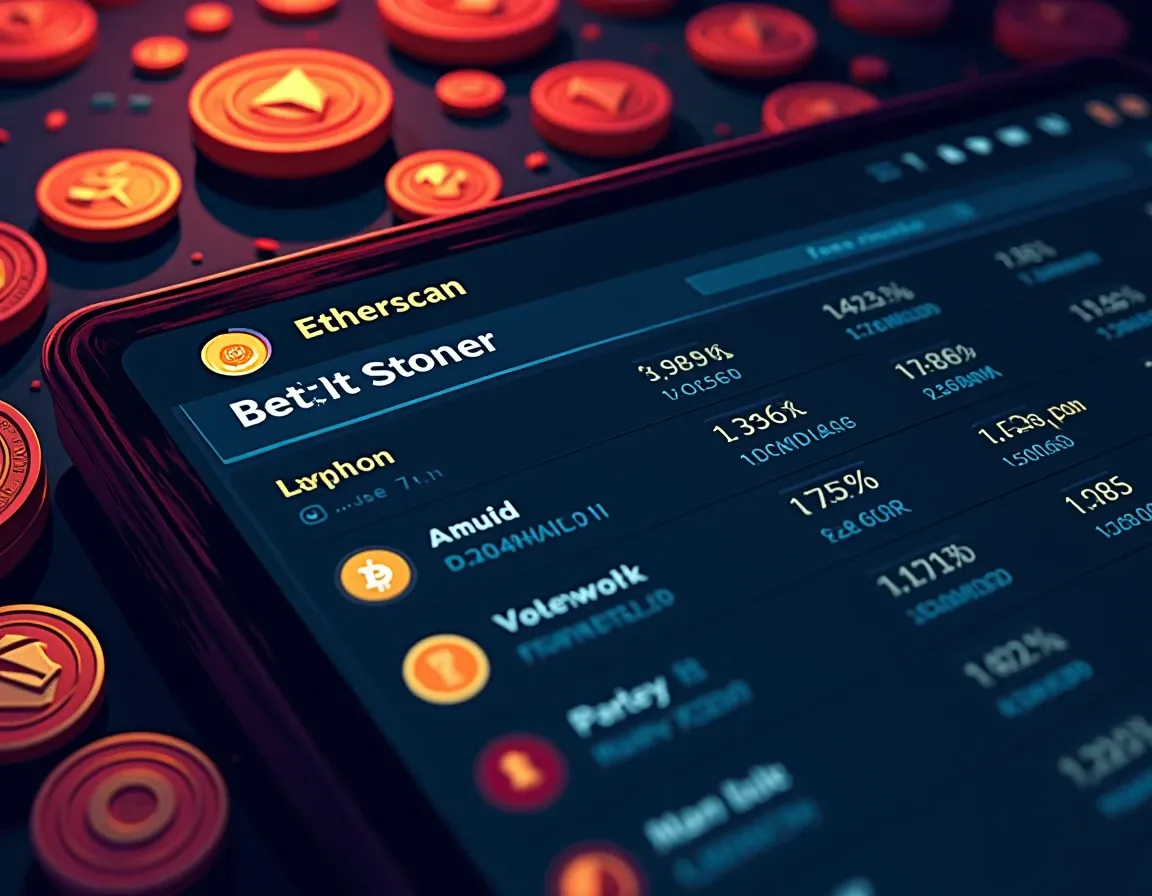
Start with the token contract address. Open Etherscan, paste the contract address into the search bar, and navigate to the ‘Holders’ tab. The page displays total supply at the top, followed by a ranked list of addresses and their percentage of total supply. The top line typically shows the largest holder, often a decentralized exchange liquidity pair or an exchange hot wallet, holding anywhere from 8% to 40% depending on the token.
Your first task is to identify which addresses represent infrastructure rather than individual ownership. Etherscan labels known exchange wallets with tags such as ‘Binance 14’ or ‘Coinbase 10’. Liquidity pool contracts are labeled with the DEX name, usually ‘Uniswap V2’ or ‘Uniswap V3: TOKEN/WETH’. Protocol treasury addresses are sometimes labeled, though smaller projects rarely receive verified tags unless they submit wallet information to Etherscan’s labeling system.
For unlabeled addresses, click through to the wallet page. If the address holds dozens or hundreds of different tokens and shows thousands of transactions, it is almost certainly an exchange wallet or aggregator contract. If the address shows only outbound transfers on a fixed schedule, it is likely a vesting contract. If the address holds a single liquidity pool token and has no outbound transactions, it is locked liquidity, not a holder who can sell.
Once you have identified the infrastructure addresses, exclude them from your calculation. Add up the percentages held by the remaining top-ten wallets. That sum is your actual concentration figure. If three of the top ten addresses are exchange wallets holding a combined 35%, and two more are liquidity pools holding 18%, then your real top-ten concentration is not 70%, it is 17%. That difference determines whether you take the position.
The process is tedious, but the alternative is buying into a token where you believe distribution is healthy when in fact four wallets control 55% of the free float and one vesting unlock will double circulating supply in thirty days. Etherscan’s ‘Download CSV’ feature on the first page of holder data allows you to export the list and build your own exclusion model if you are analysing multiple tokens regularly.
Reading The Holder List On Solscan

Solana token analysis follows the same logic but with a different interface. Open Solscan, search the SPL token mint address, and click through to the token page. The ‘Holders’ tab shows the ranked address list, and the ‘Token Holder Analytics’ section provides concentration risk summaries that Etherscan does not offer natively.
The analytics dashboard breaks down holder distribution by tier, showing how many wallets hold more than 1% of supply, how many hold between 0.1% and 1%, and so on down to dust balances. This tiered view reveals whether the token has a deep holder base or whether ownership drops off sharply after the top twenty addresses. A healthy token shows gradual distribution across hundreds of addresses. A concentrated token shows 60% in the top ten and then 8% spread across the next thousand holders, which tells you the token has whales and dust, with nothing in between.
Solscan also provides a ‘Whale Exposure’ metric and a ‘Concentration Risk’ indicator, both of which attempt to exclude known infrastructure addresses automatically. These are useful starting points, but you should verify the exclusions manually because Solscan’s tagging database is smaller than Etherscan’s, particularly for newer tokens. Click through to the largest holders and check for exchange deposit programs, staking contracts, and protocol-owned liquidity positions.
For Solana tokens, the additional complexity is that many larger holders are staking accounts or token accounts controlled by programs rather than individuals. If the holder address is a program-derived address, it may represent a staking pool, a yield aggregator, or a DAO treasury. These addresses do not represent sell pressure in the same way a individual wallet does, though they do represent governance concentration if the protocol uses token-weighted voting.
After you exclude infrastructure and program-controlled addresses, calculate the percentage held by real wallets in the top ten. Compare that figure against your risk threshold. If the number is above 40%, you are looking at a token where a small number of holders can move the market. If it is above 50%, you are looking at material rug-pull risk regardless of the team’s stated intentions.
What Concentration Level Makes A Position Untenable
The threshold that matters is not a single number. It is a function of your position size, your liquidity assumptions, and the token’s market depth. A 25% top-ten concentration is acceptable in a token with $10 million daily volume and verified team history. The same 25% is unacceptable in a token with $200,000 daily volume and an anonymous developer.
That said, there are levels where the analysis becomes simple. If a single non-custodial wallet holds more than 20% of circulating supply, that is material risk. If the top ten non-infrastructure wallets hold more than 50%, that is a strong signal that the token exists to extract value from later buyers. The 40% threshold represents the boundary where healthy distribution ends and concentration risk begins to dominate other considerations.
The Herfindahl-Hirschman Index provides a more rigorous measure for readers who want to quantify concentration with precision. The HHI sums the squares of all holder percentages, producing a score between 0 and 10,000. An HHI below 1,500 indicates unconcentrated ownership. An HHI between 1,500 and 2,500 indicates moderate concentration. An HHI above 2,500 indicates high concentration, the same threshold U.S. antitrust regulators use to evaluate market dominance in traditional industries.
For tokens, an HHI above 2,500 after excluding infrastructure addresses is a warning that ownership is concentrated enough to create exit risk that your position size cannot absorb. You can calculate HHI manually by squaring each holder’s percentage and summing the results, or you can use open-source tools that pull holder data via API and compute the index automatically. The GitHub repository linked provides working Python code for Gini coefficient, HHI, and Nakamoto coefficient calculations, with methodology notes explaining the exclusion logic for common infrastructure addresses.
The Nakamoto coefficient measures how many addresses you would need to collude to control more than 50% of supply. A coefficient below 10 is a meaningful decentralization concern. A coefficient below 5 is a red flag. If three wallets can coordinate to control majority supply, the token is not decentralized in any sense that limits exit risk, regardless of what the whitepaper claims.
Common Failure Modes And What They Look Like
The most frequent error is treating circulating supply and total supply as interchangeable. Many tokens report a circulating supply that excludes burned tokens, vesting locks, and treasury reserves, but Etherscan’s holder list shows percentages of total supply by default. If the token has burned 30% of total supply to a dead address, that address will appear as the top holder, and every other percentage will be artificially depressed. You must adjust your calculation to reflect circulating supply, not total supply, or your concentration figure will understate the real risk by whatever percentage has been removed from circulation.
The second failure mode is assuming that labeled addresses are always infrastructure. Some exchange wallets are in fact team-controlled wallets that route through exchange custody to obscure ownership. If a wallet labeled ‘Binance’ received a large transfer directly from the token deployer contract within the first week of launch, it may be a team allocation being custodied at Binance rather than genuine exchange liquidity. Cross-reference large holders against the token’s vesting schedule and deployer history before you exclude them.
The third failure mode is ignoring concentration trends over time. A token that launched with 25% top-ten concentration and now shows 48% is experiencing accumulation, most likely by insiders or by a single actor building a position large enough to manipulate price. Comparing current holder distribution against the distribution at launch reveals whether concentration is increasing, which is a stronger sell signal than the absolute level. Most block explorers do not archive historical holder snapshots, but you can track changes manually by recording top-holder percentages every thirty days.
The fourth failure mode is grouping all liquidity pool addresses as infrastructure without checking whether the liquidity is locked. A Uniswap V2 pair holding 15% of supply is not exit risk if the LP tokens are locked in Unicrypt or Team Finance for twelve months. It is direct exit risk if the LP tokens sit in an unlabeled wallet that has been active in the last week. Click through to the LP token holder to verify lock status before you exclude the position from your concentration calculation.
What To Do With The Number You Calculate
Once you have the adjusted top-ten percentage, compare it against your risk tolerance and position size. If you are allocating 2% of your portfolio to a speculative token with 35% top-ten concentration, the position is sized appropriately for the risk. If you are allocating 15% of your portfolio to the same token, you are taking counterparty risk that you cannot recover from if the top holders exit before you do.
For tokens where concentration exceeds 40%, the decision tree is simple. Either the token has a specific catalyst that justifies the risk, such as imminent exchange listings or protocol revenue growth that will drive accumulation by new holders, or it does not. If it does not, the position is speculative in the sense that you are betting you can exit before the concentrated holders do. That is a trade, not an investment, and it should be sized and monitored as such.
For tokens where concentration exceeds 50%, the analysis ends unless you have direct knowledge of who the top holders are and why they are not selling. At that level of concentration, the token’s price is determined by the actions of fewer than ten addresses, and your ability to exit depends entirely on their behavior. There are cases where this is acceptable, typically early-stage projects where the top holders are known team members or DAO treasury multisigs, but those cases require transparency that most projects do not provide.
The ongoing monitoring task is to re-check holder distribution every thirty days. Concentration can increase rapidly if whales accumulate or if smaller holders exit into low liquidity. Set a threshold at which you will exit regardless of price action. For most positions, that threshold should be 10 percentage points above the concentration level at which you entered. If you bought at 32% top-ten concentration and it rises to 42%, someone is accumulating, and that someone is not you.
The Takeaway
Holder concentration is the risk that does not show up in price charts until it is too late to exit. The top-ten percentage is the metric that quantifies that risk, but only after you exclude exchange wallets, liquidity pools, staking contracts, and protocol treasuries from the calculation. Etherscan and Solscan both provide the raw data, but neither provides the adjusted figure that actually matters. That calculation is manual, and it is the difference between a position you can exit and a position where you are exit liquidity.
The 40% top-ten threshold is the boundary where concentration begins to dominate other factors. Above 50%, the token is controlled by a small group regardless of the narrative. A single wallet holding more than 20% is material risk in any scenario. These are not soft guidelines. They are the levels at which European sovereign debt markets began pricing in default risk during the 2011 crisis, and they are the levels at which crypto tokens begin behaving like instruments whose value depends on the intentions of a small number of actors rather than on market dynamics.
If you are evaluating a token and the top-holder list shows heavy concentration, the question you should ask is not whether the team intends to rug. The question is whether your position size and exit plan account for the fact that a handful of wallets can sell before you do, and whether you have mispriced that risk because you did not exclude the addresses that represent infrastructure rather than ownership. Most holders have mispriced it. The ones who calculate the adjusted figure have an edge that compounds over every position they evaluate.
Frequently Asked Questions
What percentage of top-ten holder concentration is too high?
After excluding exchange wallets, liquidity pools, and protocol treasuries, top-ten concentration above 40% is the threshold where risk begins to dominate other factors. Above 50%, the token is effectively controlled by a small group. A single non-custodial wallet holding more than 20% of circulating supply represents material risk in any scenario. These thresholds apply to the adjusted concentration figure, not the raw percentage shown on block explorers before infrastructure addresses are excluded.
How do I know if a top holder is an exchange wallet or a real holder?
Etherscan and Solscan label known exchange wallets with tags like ‘Binance 14’ or ‘Coinbase 10’. For unlabeled addresses, click through to the wallet page. Exchange wallets typically hold dozens or hundreds of different tokens and show thousands of transactions. Vesting contracts show only outbound transfers on a fixed schedule. Liquidity pool addresses hold a single LP token with no outbound transactions. If an address shows frequent trading activity across multiple tokens, it is likely exchange infrastructure or an aggregator contract.
What is the Herfindahl-Hirschman Index and why does it matter for tokens?
The Herfindahl-Hirschman Index sums the squares of all holder percentages to produce a concentration score between 0 and 10,000. An HHI below 1,500 indicates unconcentrated ownership. An HHI between 1,500 and 2,500 indicates moderate concentration. An HHI above 2,500 indicates high concentration, the same threshold used to evaluate market dominance in traditional industries. For tokens, an HHI above 2,500 after excluding infrastructure addresses warns that ownership is concentrated enough to create exit risk your position cannot absorb.
Should I exclude liquidity pool addresses from my concentration calculation?
Exclude liquidity pool addresses only if the LP tokens are verifiably locked in a contract like Unicrypt or Team Finance. If the LP tokens sit in an unlabeled wallet that has been active recently, the liquidity represents potential exit risk and should be included in your concentration calculation. Click through to the LP token holder to verify lock status. Unlocked liquidity pool positions controlled by team wallets or anonymous addresses are direct sell pressure, not infrastructure.
How often should I re-check token holder concentration?
Re-check holder distribution every thirty days. Concentration can increase rapidly if whales accumulate or if smaller holders exit into low liquidity. Set a threshold at which you will exit regardless of price action. For most positions, that threshold should be 10 percentage points above the concentration level at entry. If you bought at 32% top-ten concentration and it rises to 42%, someone is accumulating, and that represents increasing counterparty risk that warrants position review or exit.
The Weekly Yield Report
You just learned how to exclude exchange wallets and calculate real top-ten concentration. Those percentages will shift next month, and someone will notice before you do.
Every Thursday: where crypto yield actually is – stablecoins, liquid staking and DeFi lending, with the risk named next to the rate and what changed since last week.
Free. No trade calls, no allocations, no hype. Unsubscribe in one
click.
Source link