

What You Will Learn And Why It Matters
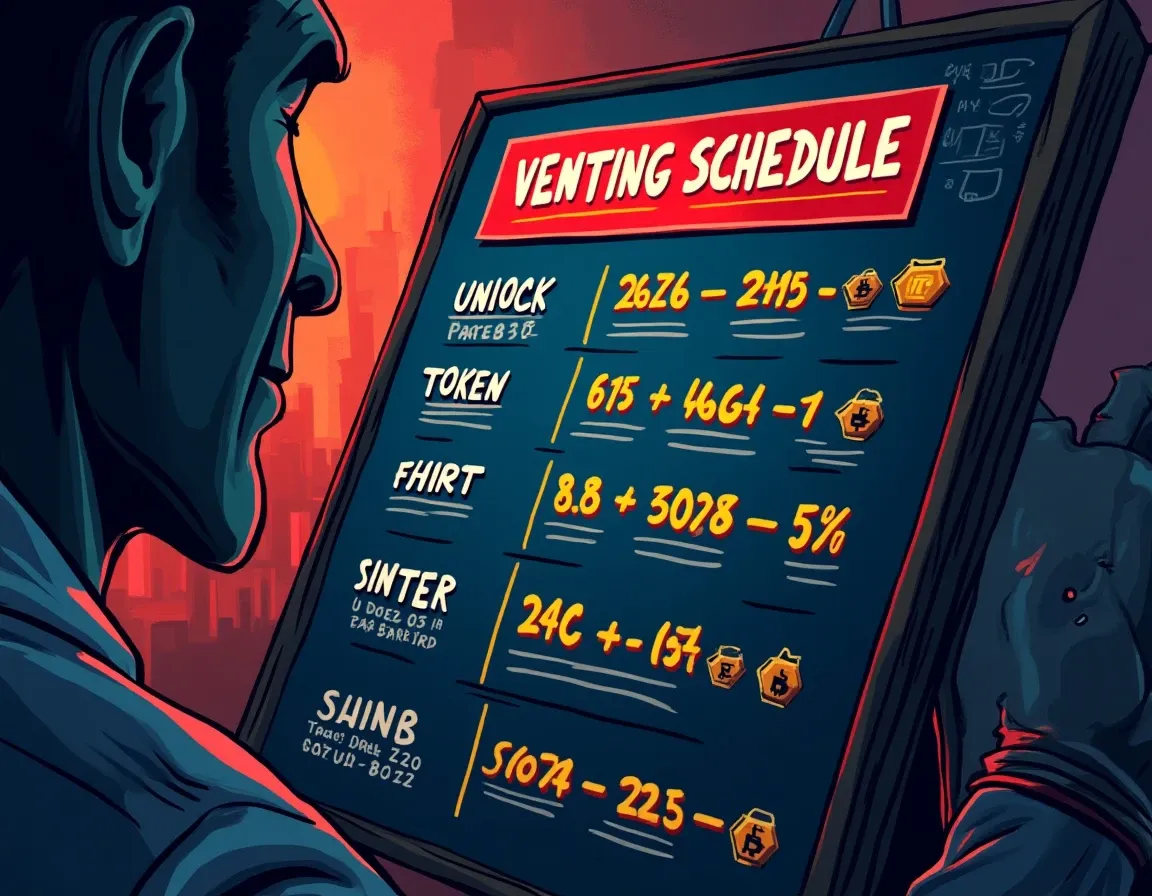
A token vesting schedule defines how much of an allocation unlocks, for whom, and on what timeline. If you buy a token without reading that schedule, you are guessing at the dilution risk embedded in your position. The schedule is public. The cliff dates are visible on-chain. The supply events are predictable. Yet most retail buyers ignore them until the price impact has already begun.
This article will show you how to find a token unlock schedule, how to read its structure, how to identify cliff dates that concentrate supply arrival, and how to calculate what percentage of circulating supply will hit the market in the next twelve months. You will learn where the data lives, why project documentation often understates the real impact, and how to cross-check stated vesting against on-chain enforcement. The objective is to time entries and exits around known supply events rather than being diluted by them.
On January 16, 2025, Arbitrum unlocked approximately 2.5 percent of its total ARB supply, roughly one hundred million dollars worth of tokens. Within seventy-two hours, ARB dropped twelve percent against a flat market. The unlock was not a hack, not a rug pull, not a surprise. It was written into the vesting contract at launch, visible to anyone who read the tokenomics documentation. Yet many holders were caught off guard.
The pattern repeats monthly. Ninety percent of unlocks create negative price pressure, regardless of size or type. Token price impacts often start thirty days before the unlock event as traders front-run the anticipated supply growth. The question is not whether unlocks matter. The question is whether you checked the schedule before you entered the position.
Where To Find Token Unlock Schedules
Start with the project’s official tokenomics documentation. Most whitepapers, litepaper decks, or dedicated tokenomics pages include a vesting table listing allocations, recipients, cliff periods, and release curves. This is the stated schedule. It is not, however, the verified schedule. Documentation can be updated after launch, rewritten to obscure early supply concentration, or simply incorrect.
For verified schedules, use aggregator platforms that pull unlock data directly from on-chain vesting contracts. The most comprehensive sources are DefiLlama Unlocks, Tokenomist, CryptoRank, and Messari. Each provides a calendar view of upcoming unlocks, filterable by date, project, and unlock size. DefiLlama displays unlocks as a timeline and allows sorting by total value unlocking. Tokenomist estimates dollar value based on current token price and shows weekly aggregates. Messari provides project-specific unlock pages with historical unlock data and future projections.
Once you have identified the token, locate its unlock page on one of these platforms. You will see a chart showing total supply, circulating supply, and the vesting curve over time. Pay attention to sharp vertical steps on the curve. Those are cliff unlocks, the points where accumulated tokens release all at once rather than gradually.
Cross-reference the aggregator data with the project’s whitepaper. Discrepancies are a red flag. If the whitepaper claims a twelve-month cliff but the on-chain contract shows six months, the contract is what matters. If the whitepaper omits mention of a large early-investor allocation but the aggregator shows it, assume the omission was intentional.
For deeper verification, find the vesting contract address in the project’s tokenomics documentation or GitHub repository, then read its parameters directly on a block explorer such as Etherscan, Solscan, or the equivalent for the chain in question. Standard OpenZeppelin vesting contracts expose functions like vestedAmount(), which returns the number of tokens that have accrued at any given timestamp. You are looking for the start date, cliff duration, and total vesting duration encoded in the contract.
How To Read The Structure Of A Vesting Schedule

A vesting schedule has five components: the recipient, the total allocation, the start date, the cliff period, and the release curve. The recipient is the group receiving the tokens, typically categorized as team, early investors, ecosystem fund, community, or treasury. The total allocation is the number of tokens assigned to that group, usually expressed as a percentage of total supply. The start date is when vesting begins. The cliff period is the duration during which no tokens are released. The release curve defines how tokens unlock after the cliff ends, most commonly linear monthly, linear daily, or in tranches.
The cliff is the mechanism that concentrates risk. During the cliff period, tokens accrue but remain locked. When the cliff ends, all accrued tokens unlock simultaneously, and the remaining allocation begins vesting according to the release curve. The standard for founders and core team allocations is a twelve-month cliff followed by linear vesting over the next twenty-four to thirty-six months. For early investors, the typical structure is a six- to twelve-month cliff followed by vesting over eighteen to twenty-four months.
Here is why the cliff matters more than the total allocation. Suppose a project has allocated fifteen percent of total supply to early investors, vesting over three years with a one-year cliff. At the end of year one, four percent of total supply unlocks at once as the cliff expires. If circulating supply at that time is twenty percent of total supply, that four percent cliff unlock represents a twenty percent increase in circulating supply in a single day. The market does not absorb that smoothly.
When reading a vesting chart, identify each allocation’s cliff date and calculate the unlock size relative to circulating supply at that time, not relative to total supply. This is the critical error most documentation encourages. Fifteen million tokens might represent only 1.5 percent of a one-billion-token total supply, but if circulating supply is two hundred million, that same unlock is 7.5 percent of the liquid float. It is the second ratio that determines price impact.
Look for the recipient type. Team and early-investor unlocks tend to see more selling than community or ecosystem-fund unlocks, because early backers are often specifically looking to realize gains. An unlock assigned to an ecosystem fund may be deployed over months through grants and liquidity incentives rather than sold immediately. An unlock assigned to early-stage venture investors is more likely to hit the market within days.
The release curve determines how concentrated the supply arrival is after the cliff. Linear daily vesting spreads the unlock smoothly. Monthly tranches create smaller but predictable pressure points. Milestone-based or price-based vesting introduces conditionality, but also opacity, because the triggering event may not be public until it occurs.
How To Identify And Calculate Cliff Unlock Impact
Cliff dates are embedded in the vesting contract and visible on most unlock aggregators. Your task is to identify the size of the cliff relative to circulating supply and to estimate whether the market can absorb it without significant price impact. The threshold to watch is five percent of circulating supply. Unlocks exceeding that level typically create measurable downward pressure.
Start by noting the cliff date for each major allocation. On the unlock aggregator, this appears as a sharp vertical step in the vesting curve. Record the number of tokens unlocking and the date. Next, find the projected circulating supply at that date. Some aggregators provide this directly. If not, calculate it by summing all prior unlocks and adding any tokens that entered circulation at the token generation event.
Divide the cliff unlock amount by the circulating supply at the cliff date. If the result exceeds five percent, expect price impact. If it exceeds ten percent, expect significant impact. If it exceeds twenty percent, the market will struggle to absorb the supply without a sharp correction.
Now estimate whether the market has the liquidity to absorb the unlock. Find the token’s average daily trading volume over the past thirty days. If the cliff unlock exceeds three to five days of average volume, absorption will be slow. Tokenomist research indicates that when an unlock exceeds roughly 2.4 times the token’s average daily trading volume, the market often cannot absorb it smoothly, and volatility spikes.
Consider the timing. Price impacts often start thirty days before the unlock event as traders front-run the anticipated supply. If you are holding a token with a large cliff approaching in sixty days, the selloff may begin in thirty. If you are planning to enter a position, waiting until after the cliff may offer a better entry price, assuming the project’s fundamentals justify holding through the event.
Here is a worked example. Suppose a token has a total supply of one billion, circulating supply of two hundred fifty million, and a cliff unlock of forty million tokens scheduled for month nine. The cliff represents four percent of total supply but sixteen percent of circulating supply. Average daily volume is eight million tokens. The unlock is five times daily volume. This is a high-impact event. Expect price pressure beginning in month eight and continuing for weeks after the unlock.
Red flags to note: no cliff period at all, vesting under twenty-four months for core teams, token generation event unlocks exceeding thirty percent of total supply, and missing on-chain implementation. If the project claims vesting but the contract is not verifiable, treat the schedule as aspirational rather than enforceable.
On-Chain Verification And What It Proves
On-chain vesting is enforced by a smart contract, verifiable on the relevant block explorer, and immune to manual error or project-team discretion. Off-chain vesting lives in a spreadsheet or an internal tool and depends entirely on the issuer executing transfers correctly and on time. Projects claiming vesting schedules without verifiable on-chain enforcement should be treated as having no vesting at all.
To verify on-chain vesting, locate the vesting contract address. This should be published in the project’s tokenomics documentation, GitHub repository, or official announcement channels. If it is not published, that is itself a red flag. Copy the contract address and paste it into the block explorer for the chain on which the token is deployed. For Ethereum-based tokens, use Etherscan. For Solana, use Solscan or Solana Explorer. For Binance Smart Chain, use BscScan.
On the contract page, navigate to the Read Contract section. Look for functions named vestedAmount, releasable, or similar. Input the current block timestamp to see how many tokens have vested as of now. Compare this figure to the stated schedule. If the on-chain vested amount is higher than the whitepaper claims, the project has accelerated vesting. If it is lower, the contract may include additional restrictions not disclosed in documentation.
Check the contract’s cliff and duration parameters. These are typically visible in the constructor arguments or in public variables. The start timestamp, cliff duration in seconds, and total vesting duration should match the stated schedule. If the contract shows a six-month cliff but the whitepaper claims twelve months, the contract is the source of truth.
Look for the beneficiary address, the wallet that will receive the vested tokens. If this address is a multisig wallet controlled by the team, that adds a layer of oversight. If it is a single externally-owned account, a single private key controls the unlock. Cross-check the beneficiary address against known team wallets or exchange deposit addresses. If vested tokens are flowing directly to an exchange, that is a sell signal.
Some projects use vesting platforms such as Streamflow, Team Finance, or Vestream. These platforms provide a user interface for creating and monitoring vesting schedules and deploy standard vesting contracts. If the project uses one of these platforms, you can view the vesting schedule directly on the platform’s interface by entering the token address or vesting contract address. This is faster than reading the contract manually and provides a visual timeline.
On-chain verification does not prevent selling. It only confirms that the stated unlock schedule is enforceable. A team with a twelve-month cliff and three-year vesting cannot access tokens before the cliff expires, but once tokens vest, they can sell immediately. Vesting schedules display the timeline over which token supply has already entered or is expected to enter circulation. Unlock events indicate the exact dates when that vested supply becomes available. Vesting does not mean holding.
Common Mistakes And How To Avoid Them
The most common mistake is calculating dilution against total supply rather than circulating supply. A five-percent unlock sounds manageable until you realize circulating supply is only fifteen percent of total, making the unlock a thirty-three-percent increase in the liquid float. Always calculate unlock size as a percentage of circulating supply at the unlock date, not as a percentage of total supply.
The second mistake is ignoring recipient type. Not all unlocks create the same selling pressure. Early investors and team members are more likely to sell than ecosystem funds or community allocations. When reviewing an unlock calendar, prioritize cliff dates for investor and team allocations. These are the events most likely to move price.
The third mistake is waiting for the unlock to check the price. Price impacts often begin thirty days before the unlock as informed traders exit positions. If you wait until the cliff date to decide whether to hold, you have already missed the window to exit without loss. Set calendar reminders for major cliff dates sixty days in advance, not on the day of the event.
The fourth mistake is trusting documentation without on-chain verification. Whitepapers can be edited. Medium posts can be updated. The vesting contract cannot be changed once deployed. If the project has not published a verifiable contract address, or if the stated schedule does not match the contract parameters, assume the worst.
The fifth mistake is assuming low initial circulating supply is bullish. A token that launches with five percent of supply in circulation and ninety-five percent vesting over the next two years is not scarce. It is a supply bomb on a timer. Low float at launch creates the illusion of scarcity and makes early price pumps easier to engineer, but it also guarantees sustained dilution pressure as vesting progresses.
What To Do Next
Before entering a position, check the unlock schedule. Go to DefiLlama Unlocks, search for the token, and review the vesting curve. Identify the next major cliff date, calculate the unlock size as a percentage of circulating supply, and compare the unlock to average daily volume. If the unlock exceeds five percent of circulating supply or three days of volume, plan your position size and exit accordingly.
Set alerts for upcoming unlocks. Most aggregators allow filtering by date and unlock size. Create a watchlist of tokens you hold or are considering, and review the unlock calendar monthly. If a large cliff is approaching, decide in advance whether to exit before the event, hold through it, or wait to enter after the supply hits.
For tokens you already hold, verify the vesting schedule on-chain. Find the contract address, read the parameters on the block explorer, and confirm that the stated schedule matches the deployed contract. If the project has not made the contract address public, that is a reason to reduce exposure.
Track how past unlocks affected price. Most unlock aggregators show historical unlock events alongside price charts. Look for patterns. Did the token drop in the thirty days before the unlock? Did it recover within sixty days after? Did selling pressure persist for months? Historical behavior is not predictive, but it is informative, particularly for tokens with regular monthly unlocks.
Incorporate unlock timing into your entry strategy. If a token you want to buy has a major cliff in three months, consider waiting. The post-unlock price is often lower than the pre-unlock price, and the market typically offers better entry points after the supply absorption is complete. Patience around known supply events is one of the few structural edges available to retail participants.
If you are evaluating a new project, read the allocation structure before you read the roadmap. A project with a thirty-percent token generation event unlock, no team cliff, and investor vesting under eighteen months is structured to benefit early backers at the expense of later buyers. That is not necessarily a reason to avoid the project, but it is a reason to size the position smaller and plan a shorter holding period.
For a systematic approach to evaluating small-cap tokens including vesting structure, see How To Screen A Low Cap Token Before You Buy. For guidance on reading the broader tokenomics framework within which vesting sits, see How To Read A Crypto Whitepaper: Spot Red Flags Fast.
The Takeaway
Token unlock schedules are public, verifiable, and predictive. The cliff dates are written into smart contracts months or years before they arrive. The dilution math is straightforward. The price impact patterns are documented. The data is free and accessible. Yet most buyers never check.
The europzone spent 2011 through 2013 discovering that yields advertised on Greek and Portuguese sovereign debt reflected the perceived probability of default rather than any actual return of principal. When the underlying credibility broke, the yields stopped being yields. They became losses that had been accruing all along, disclosed at last. Token unlocks work the same way. The dilution is not a surprise event. It is a scheduled event that most participants choose not to schedule around.
Where the unlock schedule shows a forty-percent increase in circulating supply arriving in month nine, the rational response is to adjust position size, set an exit before month eight, or wait to enter after month ten. The market does not absorb that kind of supply smoothly, and the participants who checked the calendar do not wait for the event to act. Timing entries and exits around known supply events is not speculation. It is reading the contract and believing what it says.
Frequently Asked Questions
What is a cliff in a token vesting schedule?
A cliff is a period during which no tokens are released at all. When the cliff ends, all tokens that accrued during that period unlock simultaneously, and the remaining allocation begins vesting according to the release curve. The standard for team allocations is a twelve-month cliff. For early investors, it is typically six to twelve months. Cliffs concentrate supply arrival and create predictable price impact points.
How do I verify a token unlock schedule on-chain?
Locate the vesting contract address in the project’s tokenomics documentation or GitHub repository. Paste the address into the relevant block explorer such as Etherscan or Solscan. Navigate to the Read Contract section and check functions like vestedAmount or releasable. Compare the on-chain parameters for start date, cliff duration, and total vesting duration against the whitepaper. If they do not match, the contract is the source of truth.
What percentage unlock size creates measurable price impact?
Unlocks exceeding five percent of circulating supply typically create measurable downward pressure. Above ten percent, expect significant impact. Above twenty percent, the market will struggle to absorb the supply without a sharp correction. Also compare the unlock size to average daily trading volume. If the unlock exceeds three to five days of volume, absorption will be slow and selling pressure may persist for weeks.
Why do token prices often drop before the unlock date?
Price impacts often start thirty days before the unlock event as informed traders front-run the anticipated supply. Research shows that ninety percent of unlocks create negative price pressure, and market participants who track unlock calendars exit positions in advance rather than waiting for the event. The selling begins when the unlock becomes imminent, not when it actually occurs.
What is the difference between total supply and circulating supply when calculating unlock impact?
Total supply is the maximum number of tokens that will ever exist. Circulating supply is the number of tokens currently tradable. A fifteen-million-token unlock may be only 1.5 percent of one billion total supply, but if circulating supply is two hundred million, that same unlock is 7.5 percent of the liquid float. Always calculate unlock size as a percentage of circulating supply at the unlock date, because that is what determines actual dilution and price impact.
The Weekly Yield Report
You just learned to calculate dilution against circulating supply and verify vesting on-chain. Those cliff dates change every month, and the next one is already scheduled.
Every Thursday: where crypto yield actually is – stablecoins, liquid staking and DeFi lending, with the risk named next to the rate and what changed since last week.
Free. No trade calls, no allocations, no hype. Unsubscribe in one
click.
Source link