



BNB price traded near $721 on Sep. 17 after buyers defended the $709–$710 area, but weakening daily momentum and dense liquidity above $739 leave the token without a clear breakout signal.
Summary
- BNB price recovered from a daily low near $709 but remained below resistance at $729.
- The 4-hour RSI returned to 50.84, showing balanced momentum after the rebound.
- Daily MACD recorded a bearish crossover, while the histogram fell to -5.04.
- Liquidation clusters near $710 and $740 could shape BNB’s next major move.
BNB price consolidates above $710
BNB (BNB) price was trading at approximately $721 at the time of writing, down 0.63% during the daily session. The token opened near $725.92, reached $729.22, and fell as low as $720.89 on the daily candle.
The wider chart shows that BNB remains in a consolidation phase following its early-September rally. The token climbed from below $700 to nearly $780 before sellers pushed it back toward the $710 region.
Price has since formed a tighter range between roughly $710 and $730. Repeated defenses of the lower boundary show that buyers remain active around $700–$710, but the lack of a sustained move above $730 suggests demand has not yet regained full control.
BNB’s broader structure still includes higher lows from the July bottom near $550. However, the decline from the September high has interrupted the previous bullish momentum and left the token searching for a new short-term direction.
The pullback came against a weaker risk backdrop following the failed procedural vote on the US CLARITY Act and the Federal Reserve’s 25-basis-point rate increase. Higher US interest rates can reduce demand for risk assets by lifting returns on cash and government debt.
4-hour indicators point to a neutral setup
The 4-hour Bollinger Bands show BNB trading just above the middle band at $719.39. The upper band stands at $729.15, while the lower band sits at $709.63.
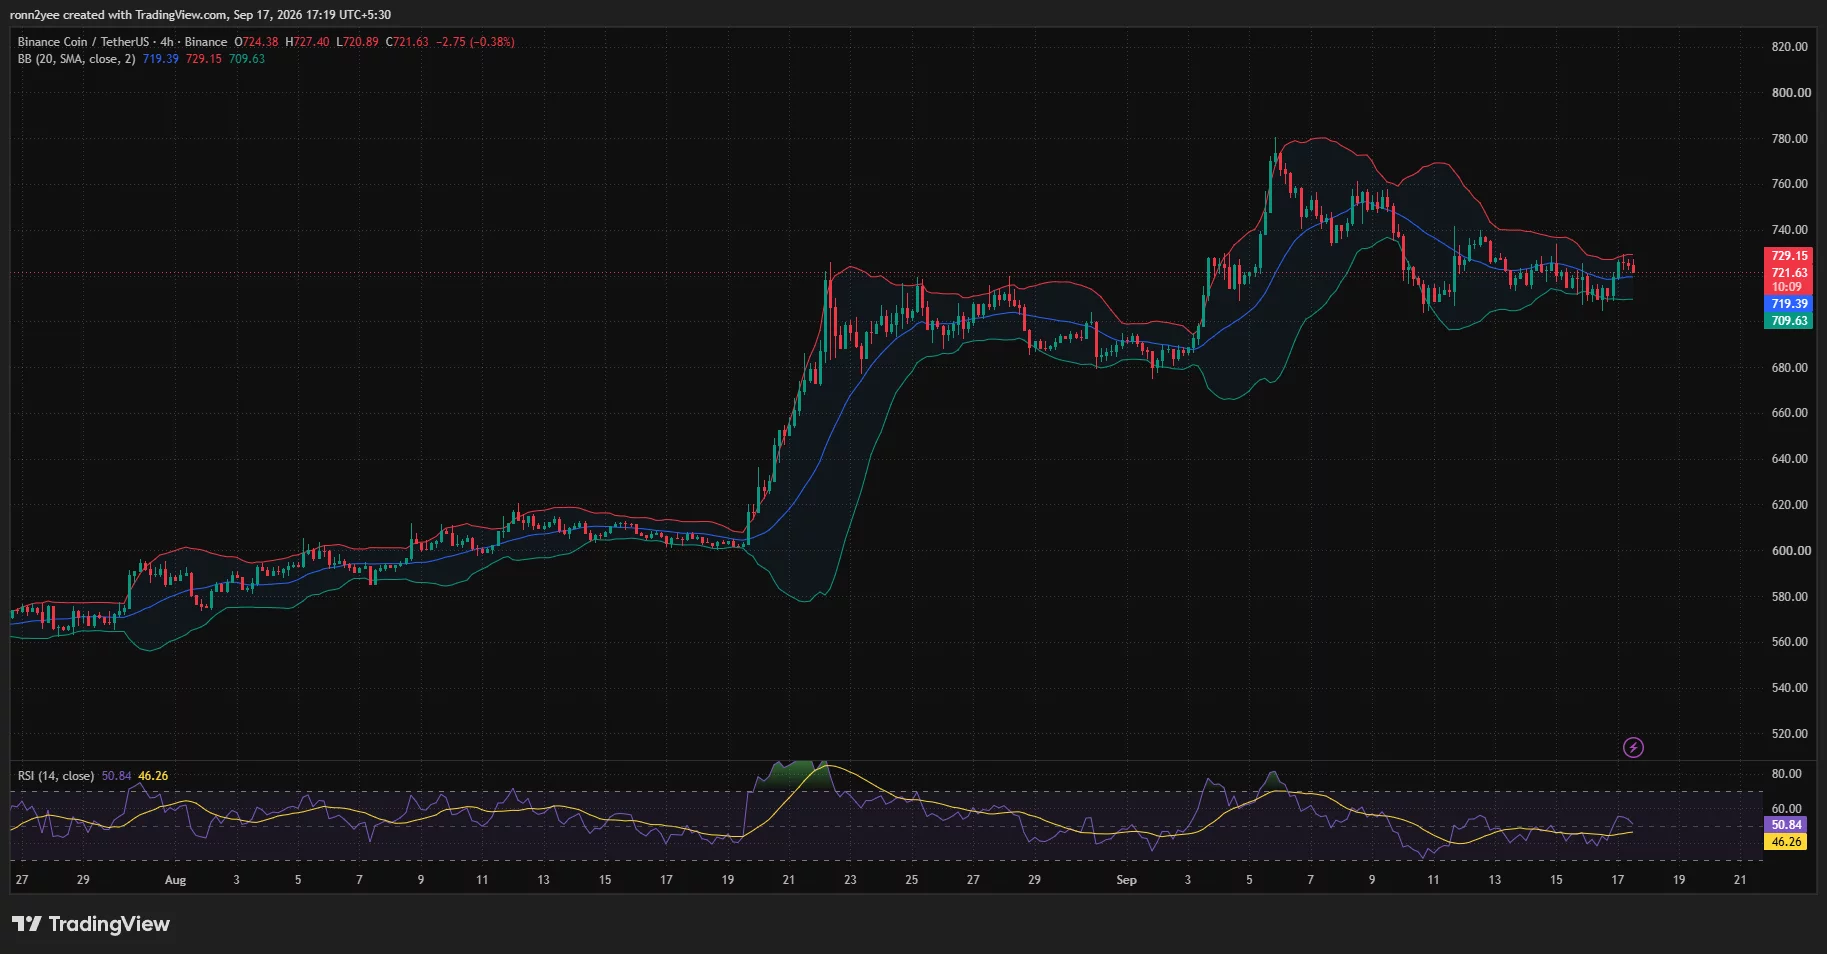
Price near the middle band reflects consolidation rather than a strong directional trend. The narrowing distance between the bands also points to falling volatility after the sharp swings seen earlier in September.
A 4-hour close above $729.15 would push BNB beyond the upper Bollinger Band and could signal renewed upside momentum. Buyers would then need to clear the $737–$740 area to establish a stronger breakout.
The lower band reinforces $709–$710 as immediate support. A decisive close beneath it would show that the current range has broken down and could expose the psychological $700 level.
BNB’s 4-hour relative strength index stood at 50.84, above its moving average of 46.26. The reading places momentum near the center of its range, with neither buyers nor sellers holding a major advantage.
The RSI’s recovery above 50 offers a modest positive signal, but it has not reached the 60–70 area normally associated with stronger bullish momentum. Price therefore needs confirmation from a resistance breakout before the indicator can support a wider recovery scenario.
Daily MACD warns of fading bullish momentum
BNB’s daily chart presents a weaker momentum picture. The moving average convergence divergence line stood at 15.14, below the signal line at 20.18, while the histogram had fallen to -5.04.
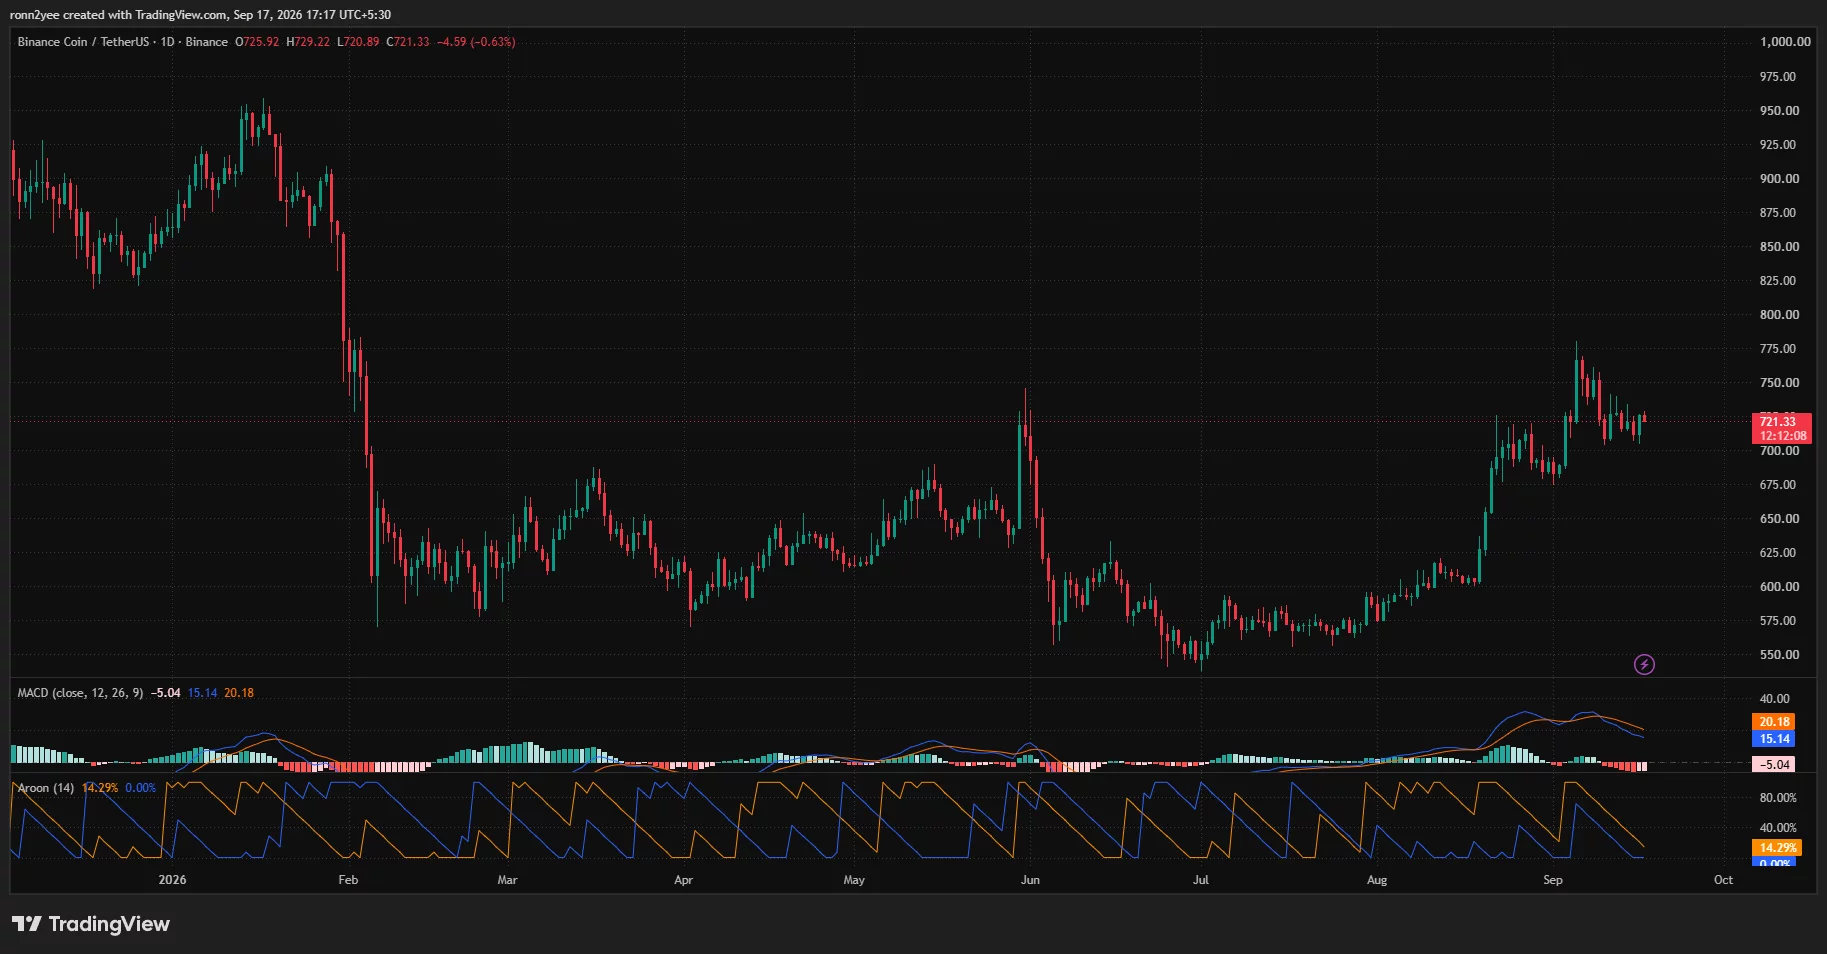
The bearish crossover shows that momentum from the late-August rally is fading. The MACD remains above the zero line, meaning the broader recovery has not fully reversed, but the negative histogram signals increasing short-term selling pressure.
Aroon readings also show limited directional strength. The indicator’s two lines had fallen to 14.29% and 0%, suggesting that neither a fresh high nor a fresh low has recently established a dominant trend.
Low Aroon readings often appear during consolidation. In BNB’s case, they support the range-bound structure visible since the price retreated from nearly $780.
For a bullish reversal, the MACD line would need to flatten and move back above the signal line. A stronger Aroon Up reading would provide further confirmation if BNB begins setting fresh short-term highs.
Liquidation heatmap places $740 in focus
The 24-hour liquidation heatmap shows concentrated leverage on both sides of BNB’s current price. The nearest lower liquidity cluster appears around $709–$712, close to the 4-hour lower Bollinger Band.
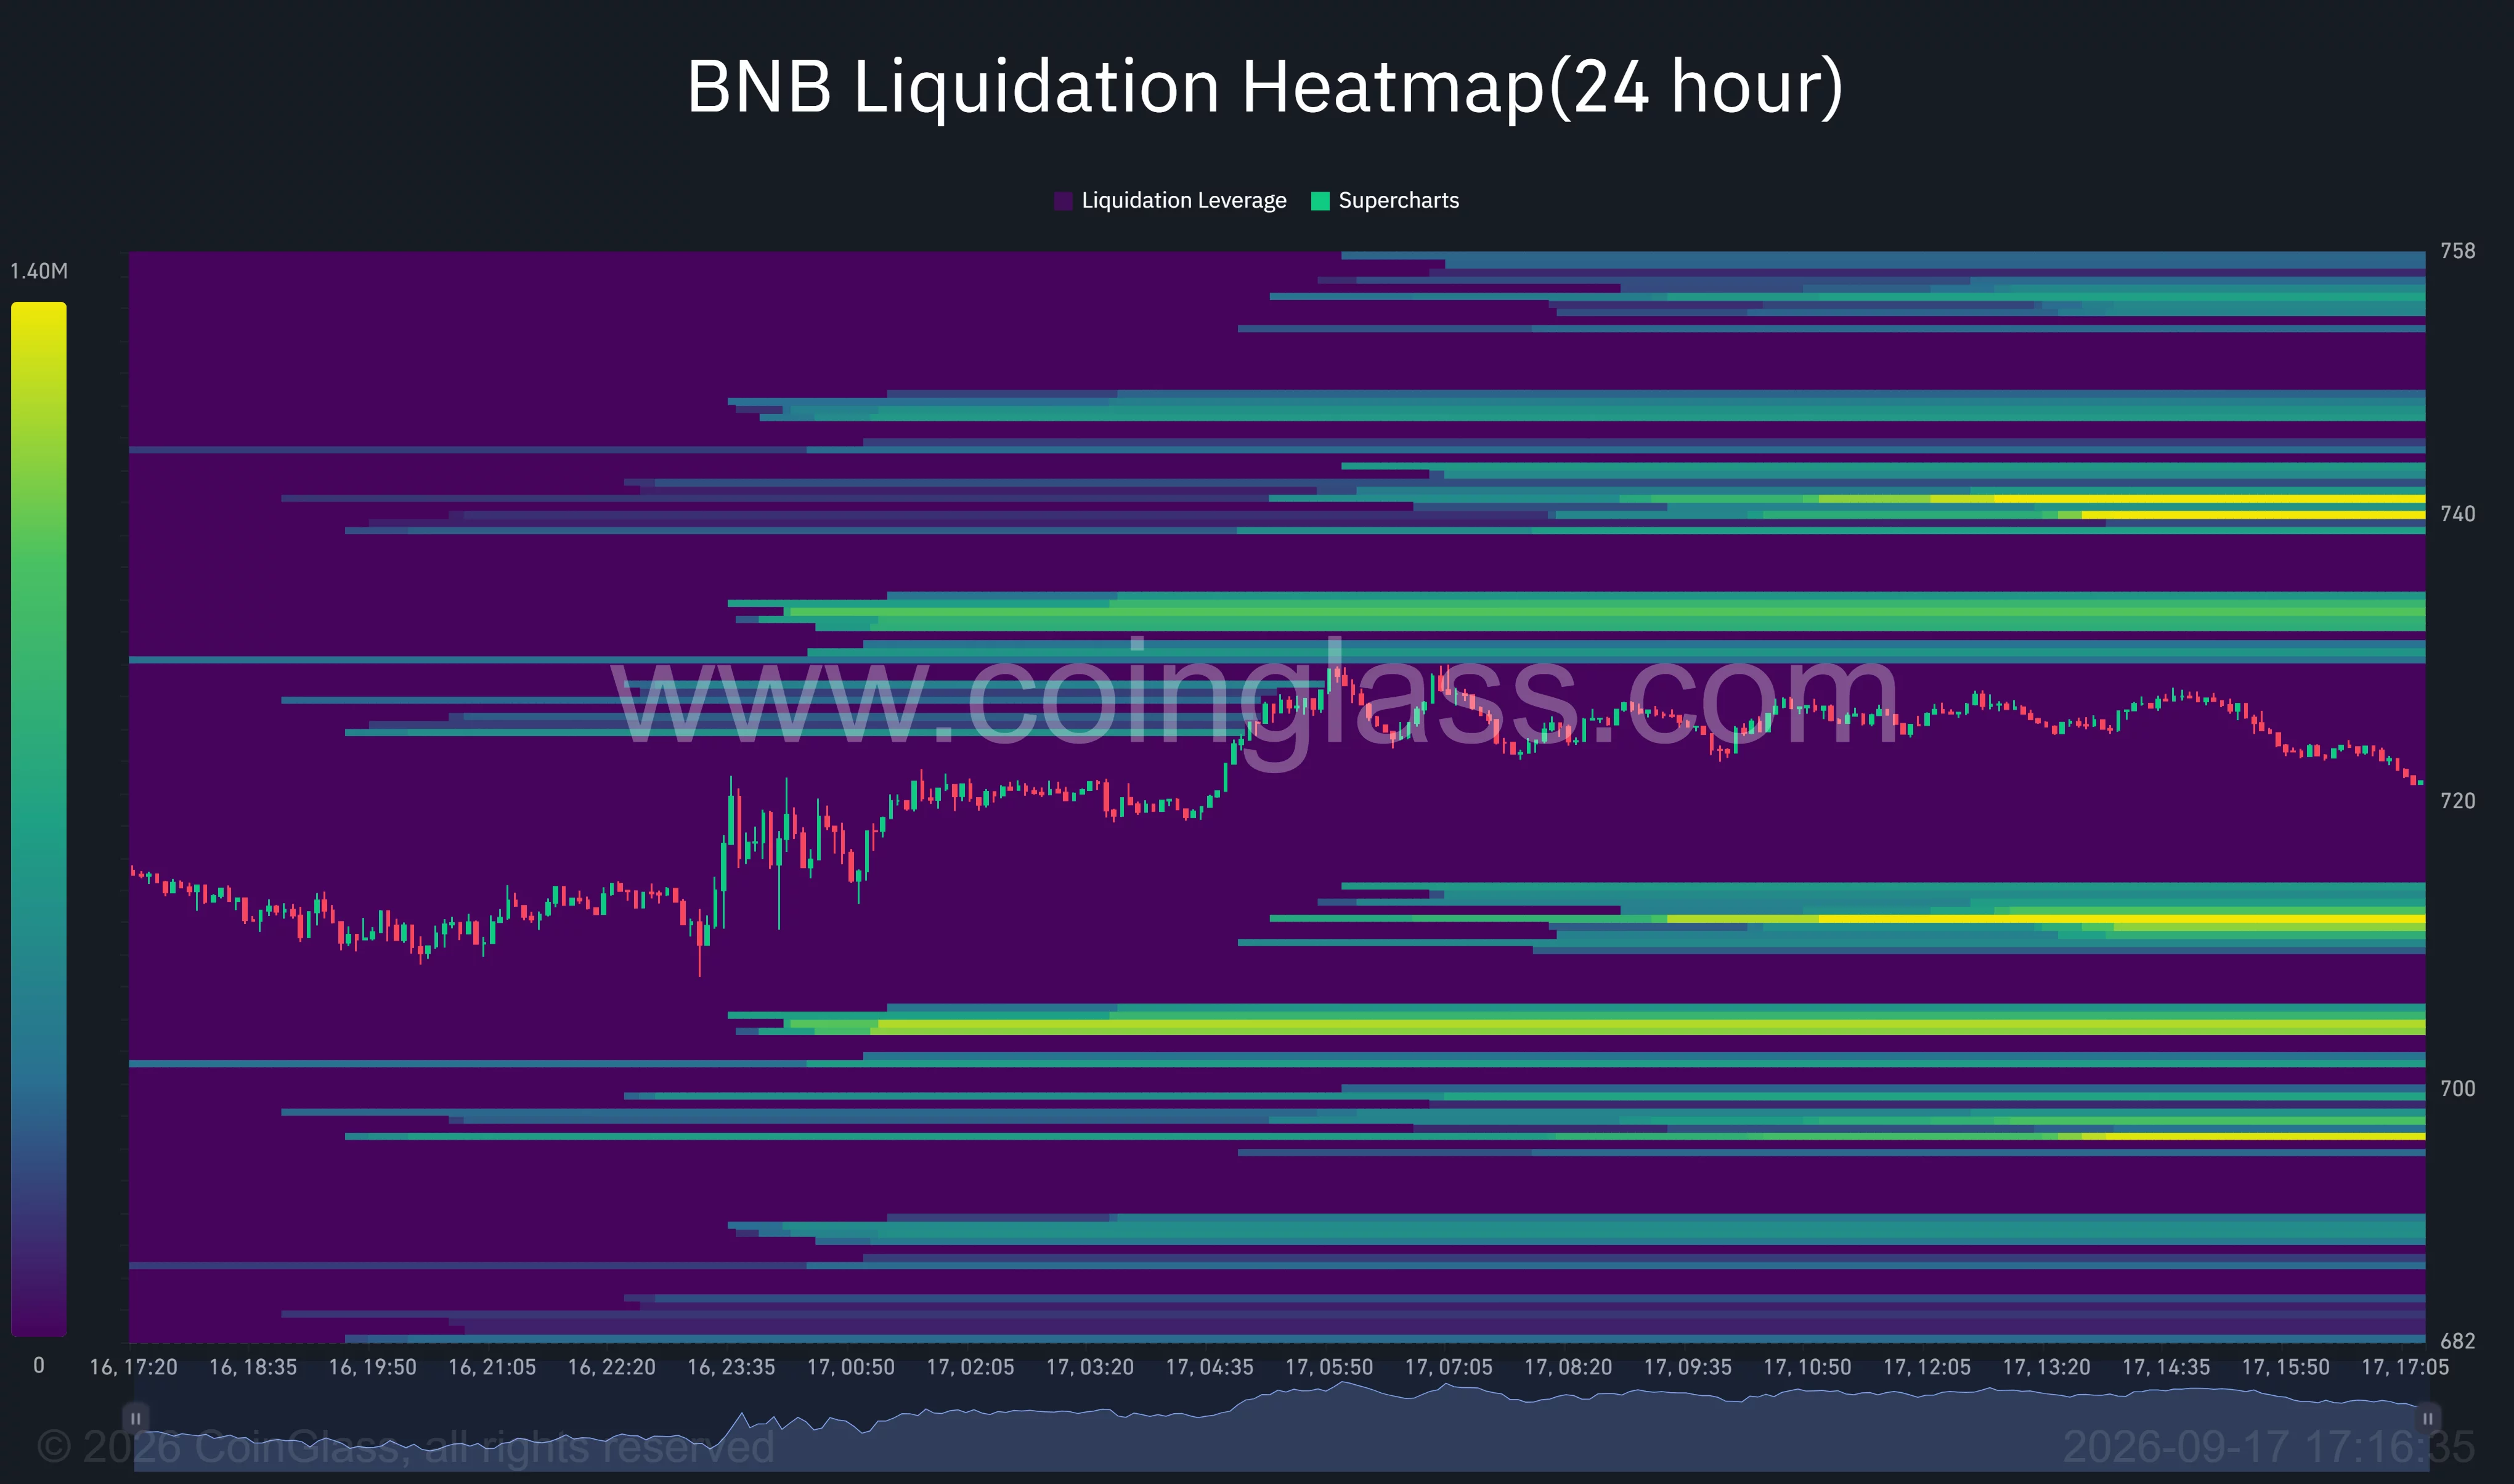
Larger pockets are also visible near $703–$705 and $695–$698. If BNB loses $709, leveraged long positions around those levels could increase downside volatility and pull the price toward $700.
Above the market, liquidity is concentrated around $727–$730, followed by a brighter and denser cluster near $739–$741. The latter area matches the resistance zone identified by the price charts.
A move through $730 could therefore draw BNB toward $740 as short positions are closed. However, the large concentration at that level may also create resistance if spot demand does not support the derivatives-driven move.
Additional liquidity appears near $747–$755, giving bulls a secondary target if BNB establishes support above $740.
BNB faces breakout test between $710 and $740
BNB’s short-term outlook depends on which side of the current range gives way first. Holding $709–$710 would preserve the consolidation and allow another attempt at $729.
A 4-hour close above $729, followed by a sustained move through $740, would strengthen the bullish case. The next targets would sit near $750 and the September peak around $775–$780.
The bearish case would gain weight if BNB closes below $709. Such a move would break the lower Bollinger Band and could trigger liquidations toward $703, $700, and $695. A loss of $695 would weaken the broader recovery structure and place the late-August breakout area near $680 back in view.
For US investors, the Federal Reserve’s rate path and any further action on crypto market-structure legislation remain potential sources of volatility. Technically, however, $710 support and $740 resistance provide the clearest boundaries for BNB’s next directional move.
Disclosure: This article does not represent investment advice. The content and materials featured on this page are for educational purposes only.
Source link