



Ethereum price has remained trapped below $2,000 as rising oil prices, renewed interest-rate concerns and BitMEX’s planned shutdown have tempered bullish sentiment despite continued spot ETF inflows.
Summary
- Ethereum price remains below $2,000 as higher oil prices revive Federal Reserve rate-hike concerns.
- Spot ETF inflows and positive capital flows continue to support ETH above $1,900.
- A break above $1,955 could target $2,030, while losing $1,860 would weaken the recovery.
According to data from crypto.news, Ethereum (ETH) price traded near $1,927 on July 23 after reaching an intraday high of $1,941. The token has recovered more than 27% from its June low near $1,514, but repeated failures around $1,955 have kept the psychological $2,000 level beyond buyers’ reach.
Oil supplied the latest macro pressure as Middle East tensions pushed crude prices higher for a fifth consecutive session. West Texas Intermediate rose above $90 a barrel after attacks by Iran-aligned Houthis on Saudi oil tankers raised concerns about regional supplies. Higher energy costs could feed inflation and reduce the Federal Reserve’s room to keep monetary policy unchanged.
Rate traders have already adjusted their positions. The probability of a September Fed hike rose to 79% from 68% per data from the CME FedWatch tool. Expectations for the July meeting remain centered on no change, but another oil-led inflation increase could lift Treasury yields and pressure risk assets such as Ethereum.
U.S. equities also weakened after Alphabet raised its 2026 capital-spending forecast to between $195 billion and $205 billion. The company recorded negative free cash flow of $5.9 billion as quarterly expenditure doubled to $44.9 billion, while its shares fell in premarket trading.
A retreat across technology stocks could limit speculative demand in crypto markets because both sectors remain sensitive to interest-rate expectations.
ETF demand has kept Ethereum above its rising support structure
Institutional flows have provided a counterweight to the macro uncertainty. U.S. spot Ethereum ETFs recorded $72.64 million in net inflows on July 22, according to SoSoValue. BlackRock’s iShares Ethereum Trust accounted for $53.47 million, showing that regulated products continued to attract capital even as ETH struggled below $2,000.
BitMEX added a separate source of uncertainty after announcing that it would cease operations on Sept. 23 following a strategic review by parent company HDR Global Trading. The exchange told customers to close positions and withdraw funds before the deadline. BitMEX helped popularize perpetual swaps and has served more than 2 million professional and institutional traders since its 2014 launch.
Position transfers and forced closures at BitMEX could temporarily reduce liquidity or move leverage to rival exchanges. However, the announcement does not mean Ethereum’s global perpetual market will close, because Binance, Bybit, OKX and other venues operate larger derivatives businesses.
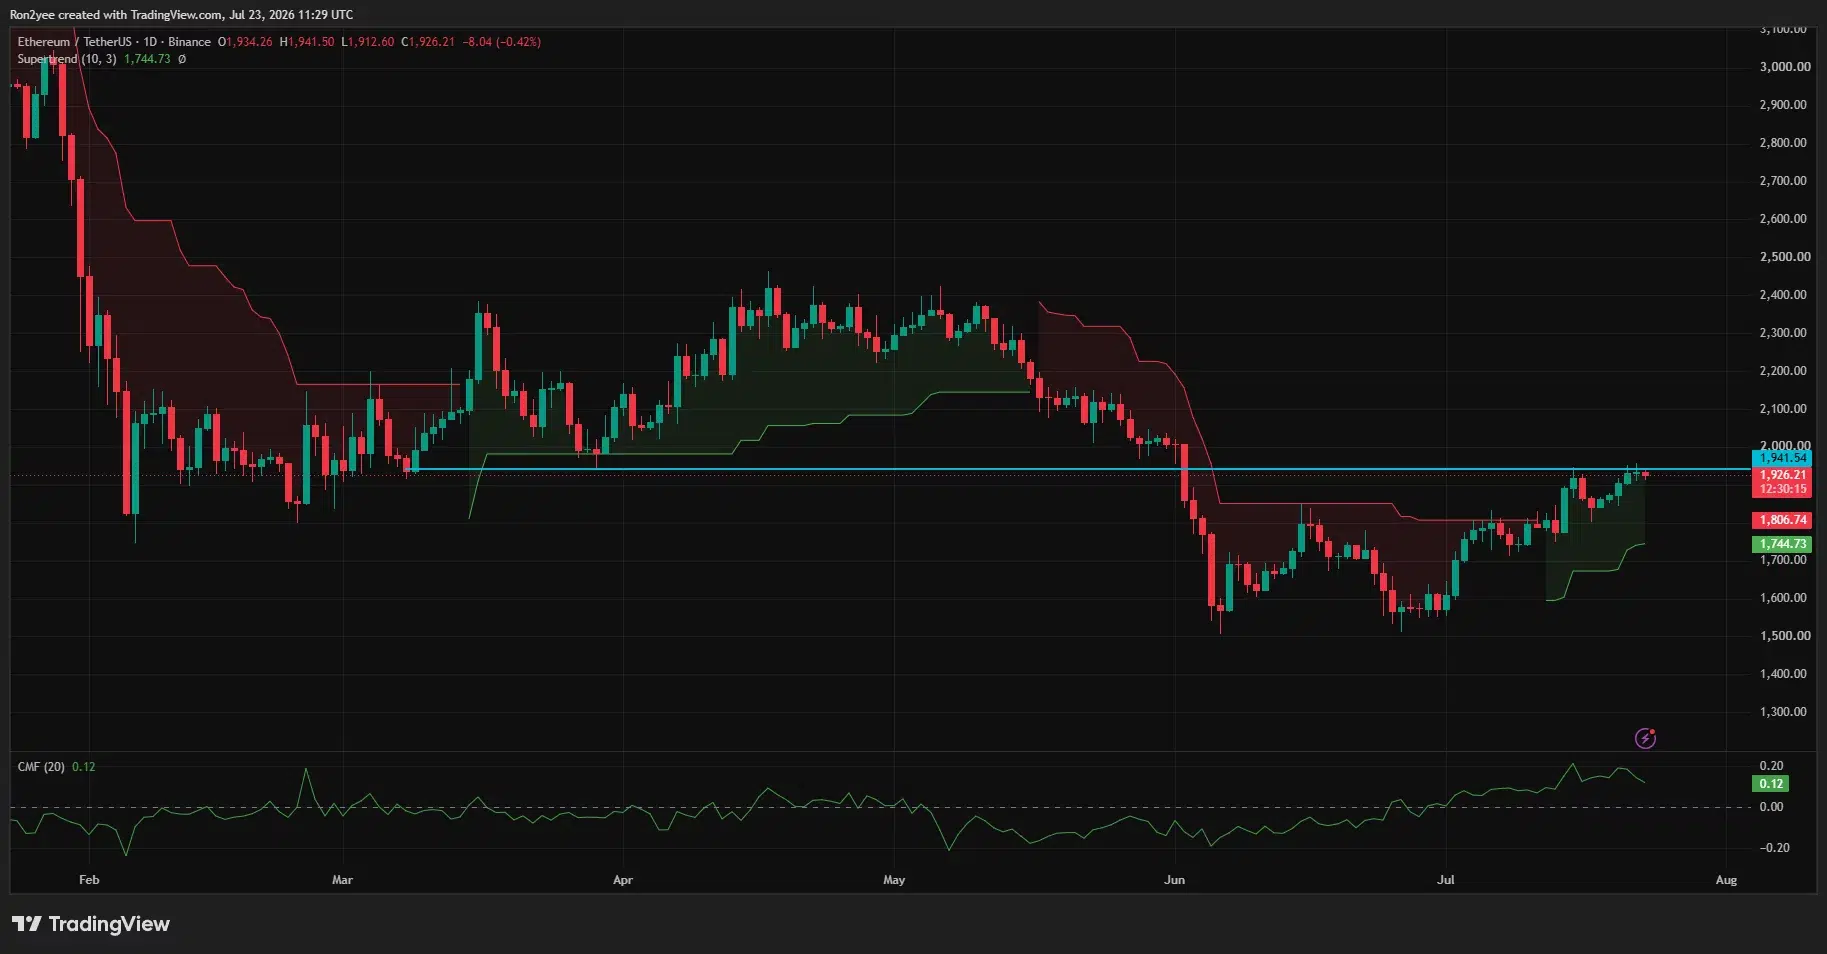
Ethereum’s daily chart remains constructive above the Supertrend support at $1,744.73. The indicator has stayed green during the July advance, while the Chaikin Money Flow reading of 0.12 shows that buying volume has exceeded selling volume over the indicator’s measurement period. Price must still close above the nearby $1,941–$1,955 ceiling before the daily structure opens a route toward $2,000.
According to analyst Ted Pillows, spot-market demand has protected the recovery’s main support zone.
“Spot demand is strong and the key support zone hasn’t been lost. IMO, Ethereum could begin its next move up in a few days.”
Pillows placed $2,030 as the first major upside barrier, followed by $2,179 and a heavier supply zone near $2,400. His chart also identified support between roughly $1,834 and $1,897, with lower demand areas around $1,730 and $1,540.
The 4-hour chart shows ETH compressing beneath $1,955.40 while holding an ascending trendline drawn from the June 26 low. Buyers have also defended the 78.6% Fibonacci retracement at $1,860.86, leaving the sequence of higher lows intact. A 4-hour close above $1,955 would clear the recovery high and place $2,000–$2,030 within reach.
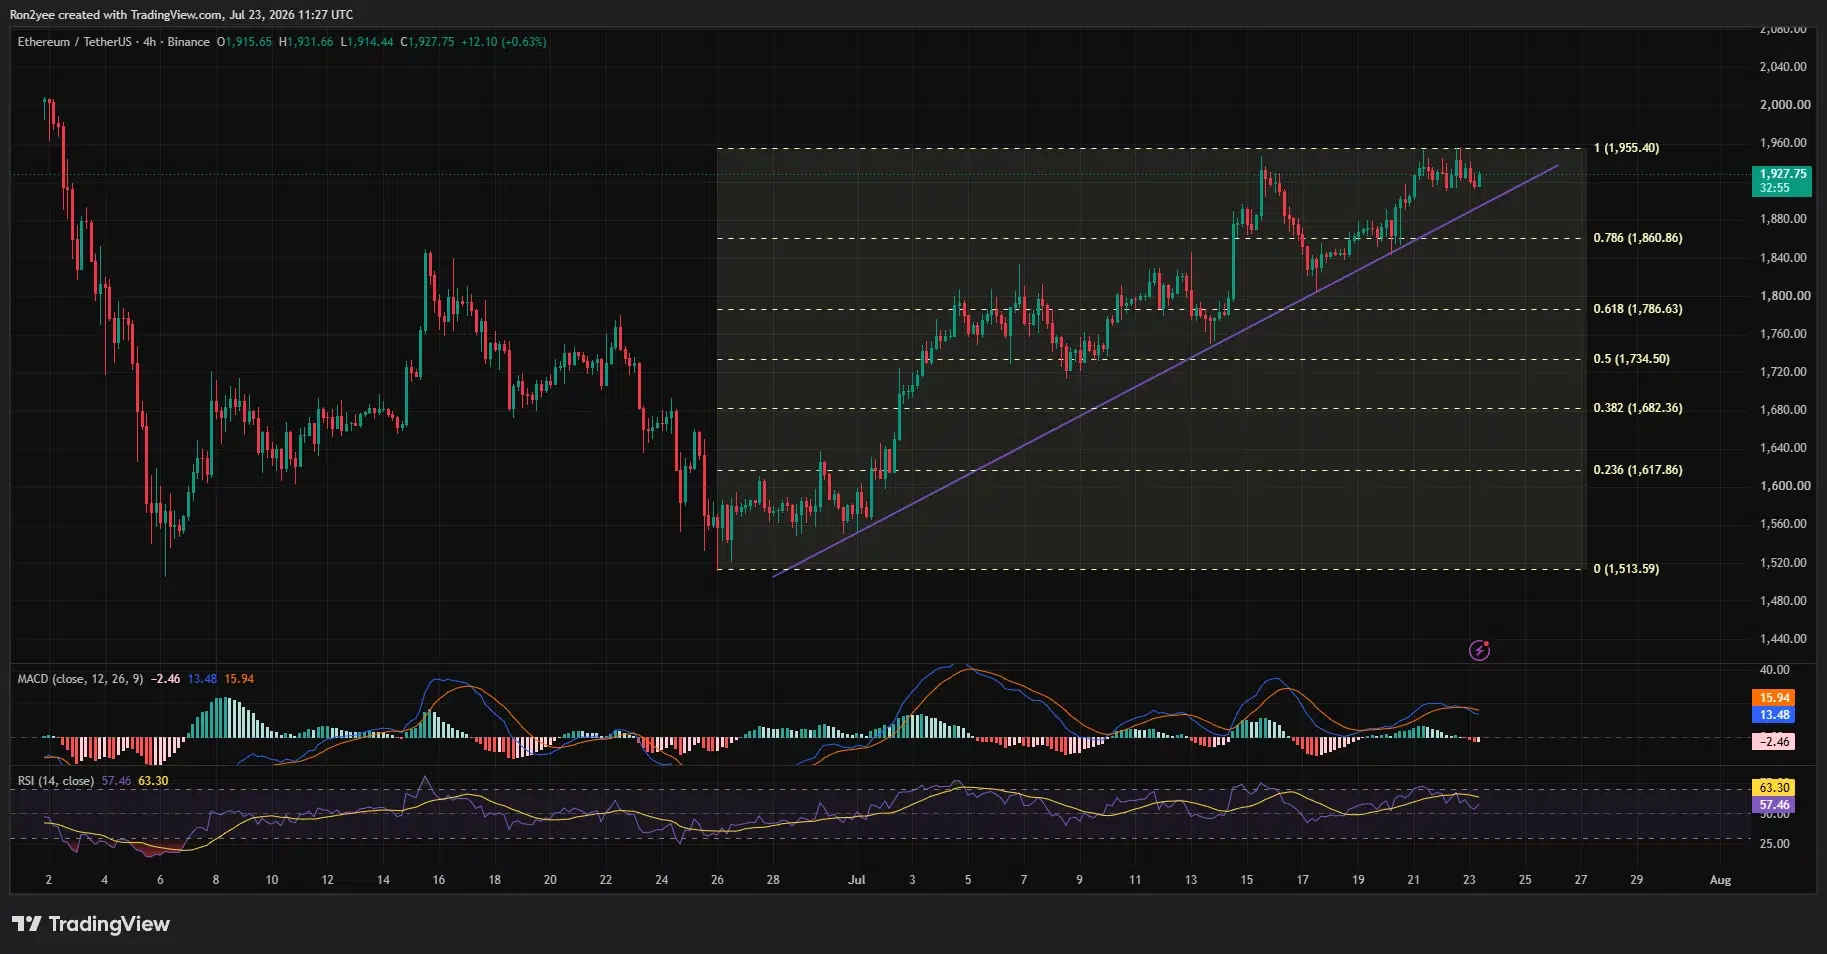
Momentum has weakened before that test. The 4-hour Relative Strength Index has fallen to 57.46 from its recent highs and sits below its signal average of 63.30. MACD has also registered a bearish crossover, with the MACD line at 13.48 beneath the 15.94 signal line and the histogram at minus 2.46. Neither indicator confirms a trend reversal, but both show that buyers have lost speed near resistance.
Break below $1,860 would invalidate the immediate breakout setup
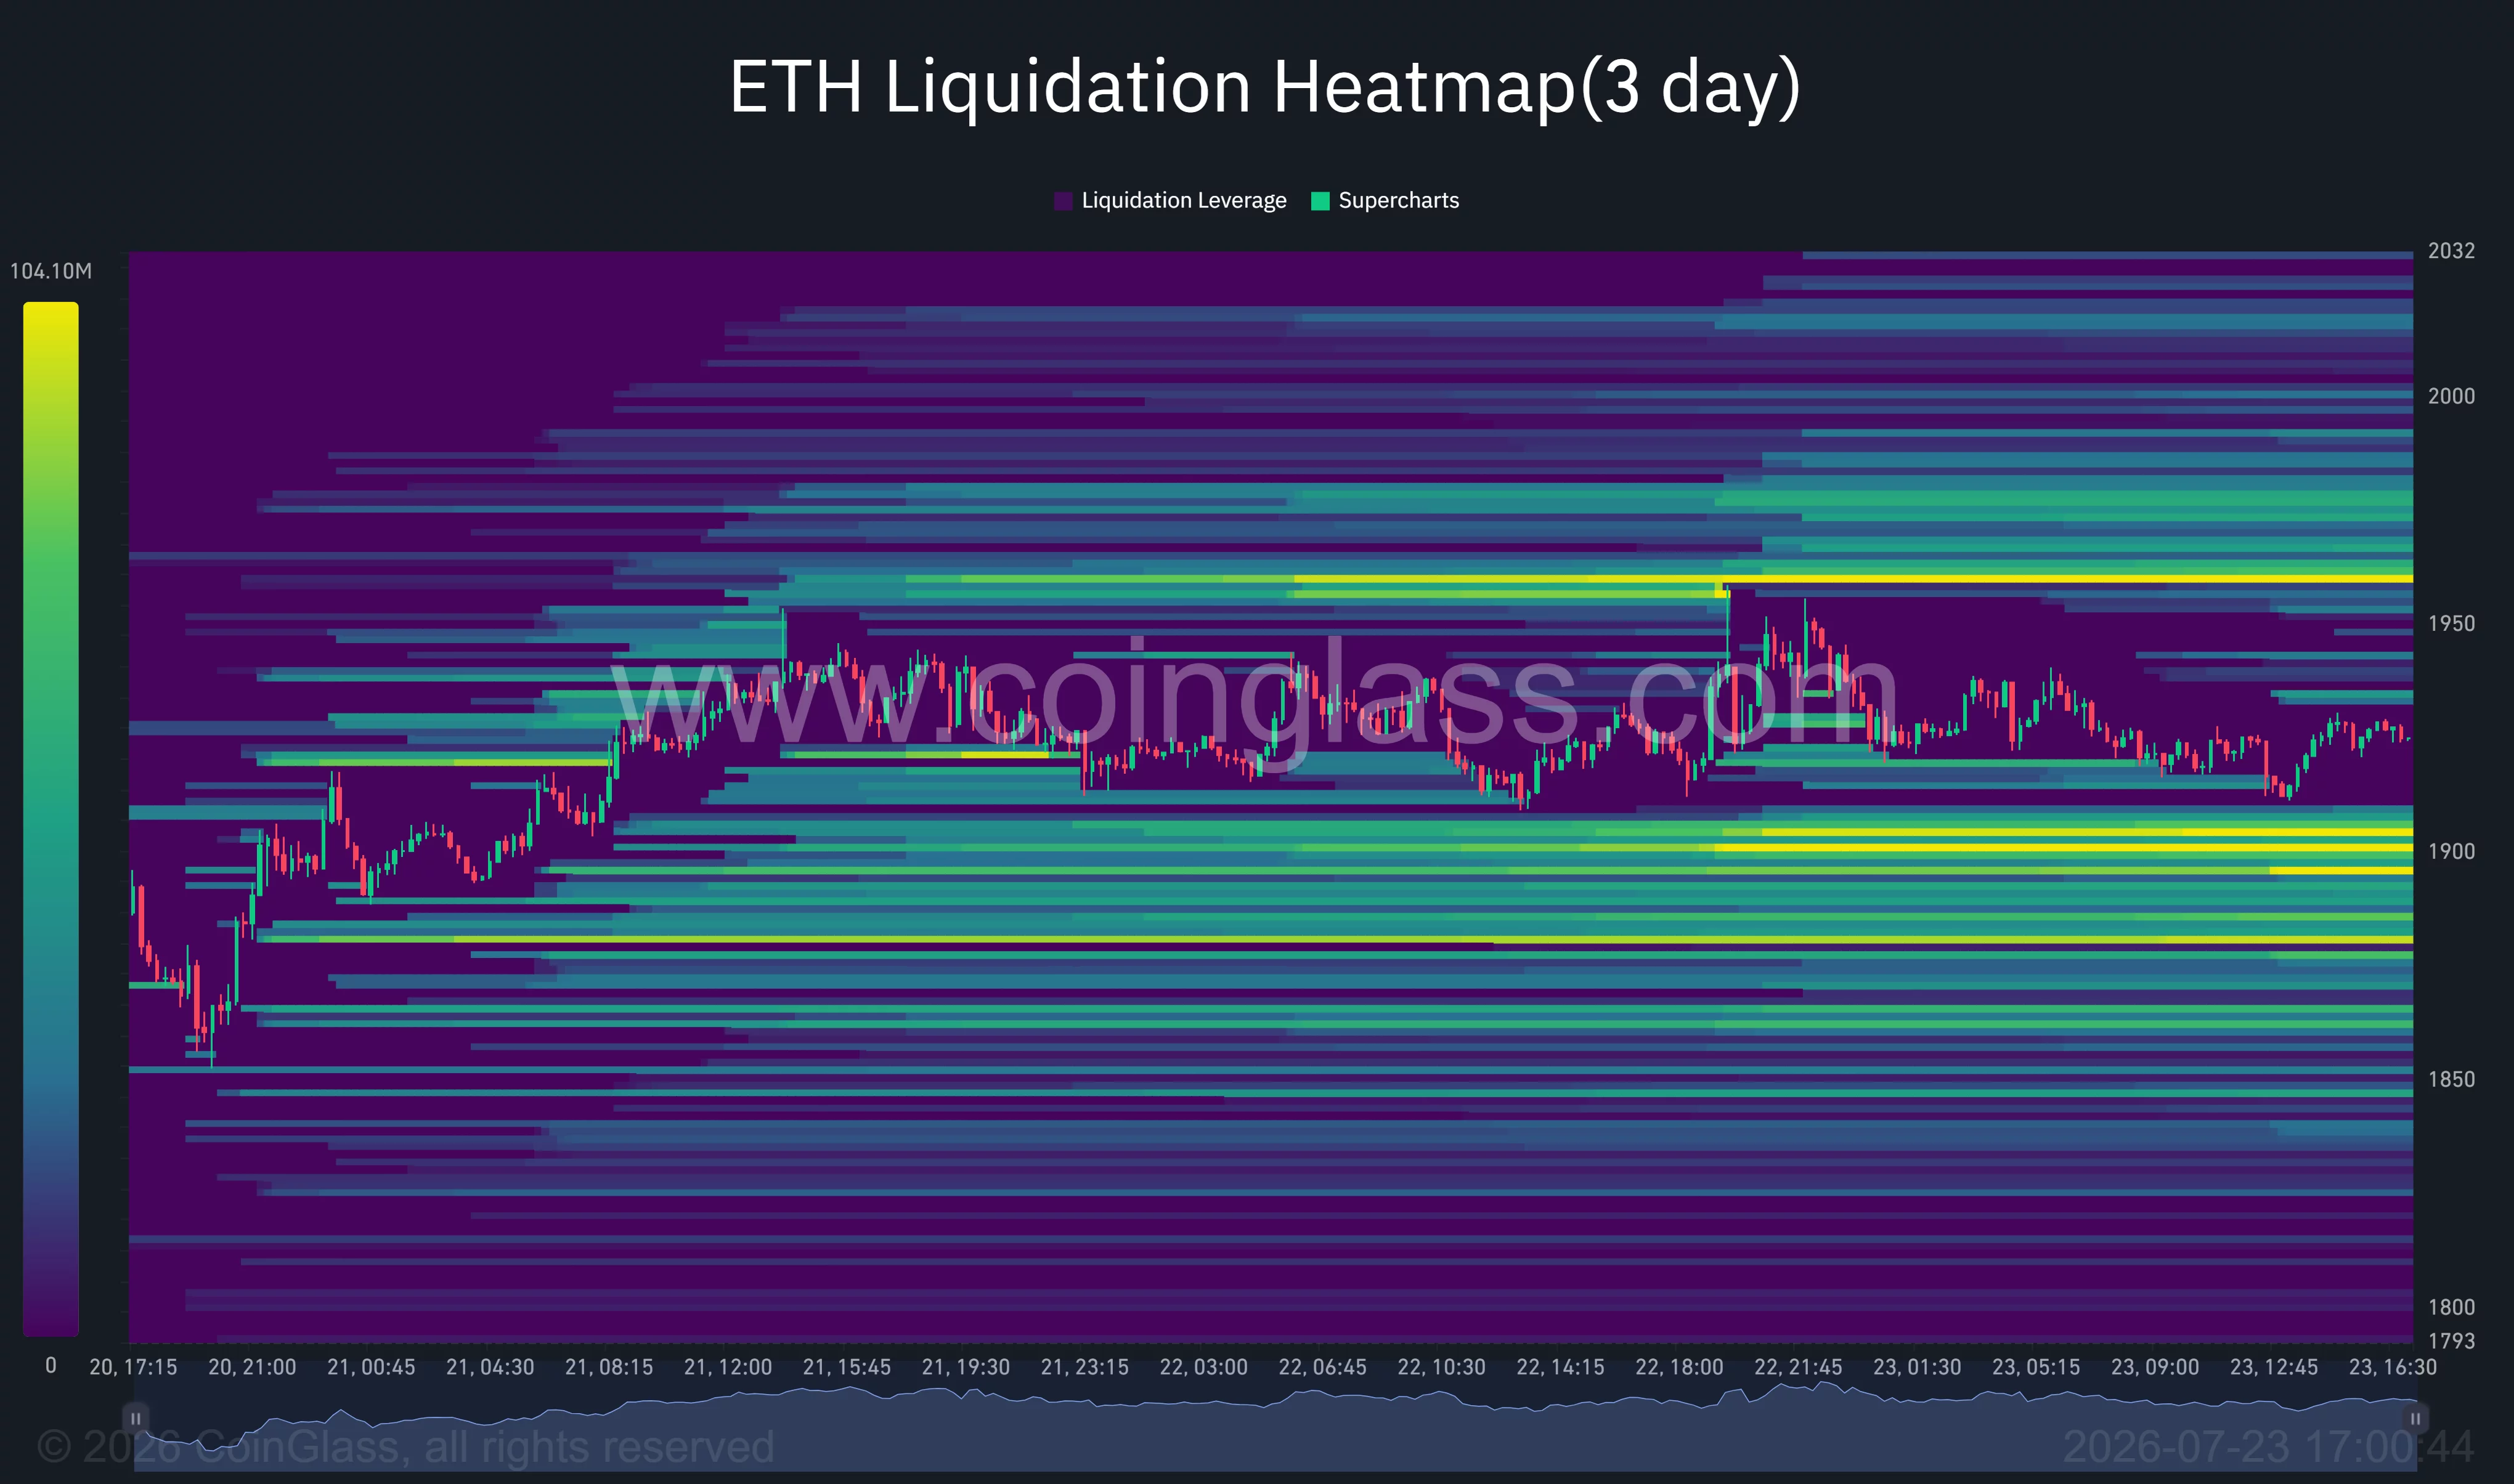
CoinGlass’s three-day liquidation heatmap places the largest nearby short-liquidation concentration around $1,958–$1,965. A move through that band could force bearish positions to close and accelerate a test of $2,000. The strongest downside liquidity sits near $1,895–$1,905, with another dense pocket around $1,875.
Failure to hold the rising 4-hour trendline would expose the $1,860 Fibonacci level first. A close below that support would weaken the higher-low structure and raise the risk of a decline toward $1,786.63, followed by daily Supertrend support near $1,745. Losses below $1,745 would invalidate the current recovery thesis and reopen $1,682.
Oil supply disruptions, a higher September rate-hike probability, and forced position reductions before BitMEX closes remain the main external risks. Ethereum needs sustained spot volume above $1,955 to confirm a breakout; without it, liquidity around $1,900 may continue to pull price back into the established range.
Disclosure: This article does not represent investment advice. The content and materials featured on this page are for educational purposes only.
Source link