

Which Patterns Actually Matter
Inverse head-and-shoulders succeeds 84% of the time when properly validated. Head-and-shoulders reverses trends with 82% accuracy. Double bottoms work in 82% of confirmed setups. These numbers come from altFINS’ AI engine analyzing thousands of crypto trades across four timeframes.
The success rate drops to 45-50% without volume confirmation. That gap explains why retail traders lose money on patterns that institutional desks trade profitably.
Chart patterns work in crypto because they describe how traders behave at recognizable structures. The skill is not memorizing names. It’s reading what each pattern says about supply, demand, and volatility at that moment.
Eight patterns have documented predictive value across Bitcoin and Ethereum on daily timeframes: head-and-shoulders (and its inverse), ascending and descending triangles, cup-and-handle, rising and falling wedges, double tops and bottoms, and bull and bear flags. Each appears repeatedly. Each resolves in predictable ways when combined with volume and timeframe validation.
Head-and-Shoulders: The Reversal Pattern That Works
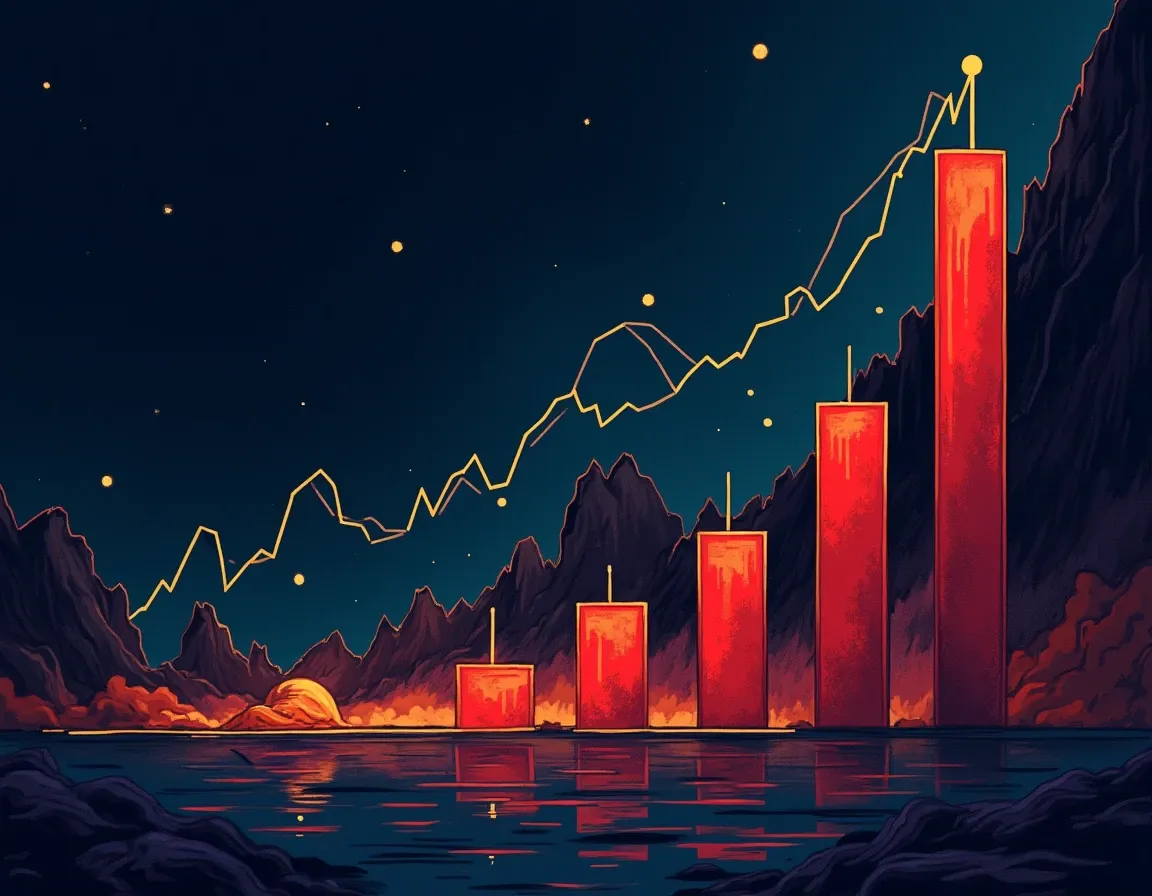
A head-and-shoulders forms at the end of an uptrend. Price makes a high (left shoulder), pulls back, rallies to a higher high (head), pulls back again, then makes a lower high (right shoulder). The neckline connects the two pullback lows.
The pattern signals that buying pressure is exhausting. Each successive rally attracts fewer buyers. When price breaks the neckline on volume, the trend has reversed.
The inverse version appears at the end of downtrends. Left shoulder, lower low (head), right shoulder. Neckline connects the rally highs between shoulders. Breakout above the neckline on volume confirms the reversal.
In crypto, the failure rate sits closer to 20-30% because of thin liquidity during off-hours, exchange-specific wicks that trip necklines without genuine buying or selling, and leveraged positions that create forced liquidation cascades. A head-and-shoulders pattern forming during Asian session hours with 30% of normal volume is far less reliable than one completing during New York and London overlap.
Volume must increase on the neckline break. If price drifts through the neckline on declining volume, the pattern has not confirmed. Wait for the retest, then watch whether buyers or sellers control that level.
Triangles: Compression Before Expansion

Triangles form when price oscillates between converging trendlines. Ascending triangles have a flat top and rising lows. Descending triangles have a flat bottom and falling highs. Symmetrical triangles have both lines converging toward an apex.
Ascending triangles typically break upward. Sellers keep defending the same level (flat top), but buyers keep bidding higher (rising lows). Eventually buyers overwhelm that resistance. The measured move is the height of the triangle added to the breakout point.
Descending triangles usually break downward. Buyers defend the same support level, but sellers keep offering lower. When support fails, the breakdown accelerates.
Symmetrical triangles are neutral. They represent indecision. The breakout direction depends on which side wins. Volume on the breakout tells you whether the move is genuine.
For crypto specifically, triangles on the 4-hour and daily timeframes produce the most reliable results. Lower timeframes generate too many false signals because order book depth changes rapidly and a single large trade can break a trendline that would hold on a higher timeframe.
The ascending triangle pattern breaks out successfully about 80% of the time when it forms over 6-12 weeks and breaks on volume 50-200% above the 20-period average. Without that volume surge, reliability drops below 50%.
Cup-and-Handle: The Continuation Setup Institutional Desks Trade
Cup-and-handle ranks third out of 39 bullish chart patterns in Bulkowski’s research. It has a 5% break-even failure rate and an average rise of 54% after breakout.
The pattern starts with an uptrend, followed by a 30-50% correction that forms a rounded bottom (the cup), then a smaller pullback (the handle) before the next leg up. Use Fibonacci retracement on the prior uptrend. The cup should retrace to the 30-50% zone. If it retraces deeper than 50%, the pattern loses reliability.
The handle forms when early buyers take profit after the cup completes. It should retrace no more than one-third of the cup’s advance. The handle typically lasts 1-4 weeks. Breakout above the handle’s high on volume confirms the pattern.
This pattern works because it filters out weak holders. The cup shakes out sellers. The handle gives late sellers one more exit. Buyers who remain have higher conviction. When price breaks out, there is less overhead resistance.
In crypto, cup-and-handle patterns appear most often on daily and weekly charts for large-cap assets like Bitcoin and Ethereum. They are rare on low-cap tokens because those lack the sustained buying required to form a clean cup.
Double Tops and Double Bottoms: Failed Retests That Become Reversals
A double top forms when price rallies to a level, pulls back, then rallies again to approximately the same level and fails. The pattern completes when price breaks below the pullback low on volume.
Double bottoms are the inverse. Price declines to a level, bounces, declines again to the same area, and bounces harder. Breakout above the bounce high confirms the reversal.
These patterns appear frequently during the transition from bull runs to corrections. The first top or bottom represents the initial exhaustion of the trend. The second attempt confirms that momentum has shifted.
The measured move is the distance between the peaks (or troughs) and the middle low (or high). If a double top has peaks at $50,000 and a middle low at $45,000, the measured target after breakdown is $40,000.
False breakouts are common. A true double top or bottom requires volume confirmation on the breakout and follow-through over multiple periods. If price breaks the neckline, then reverses within 1-3 candlesticks, the pattern has failed. That failed breakdown or breakout often produces a strong move in the opposite direction because it traps traders on the wrong side.
Wedges: Rising Exhaustion and Falling Compression
Rising wedges form when price makes higher highs and higher lows, but the highs are rising slower than the lows. The trendlines converge upward. This pattern is bearish because it signals that buyers are losing momentum even as price rises.
Falling wedges show the opposite. Price makes lower lows and lower highs, but the lows are falling slower than the highs. Trendlines converge downward. This is bullish because sellers are exhausting even as price declines.
Wedges resolve when price breaks the lower trendline (rising wedge) or upper trendline (falling wedge) on volume. The breakout typically retraces a large portion of the wedge’s range.
In crypto, wedges often form during overnight sessions or weekends when volume thins out. A wedge that breaks during low-liquidity hours has a higher failure rate. Validate the breakout by checking whether it holds through the next high-volume session.
Flags and Pennants: The High-Probability Continuation Patterns
Bull flags and bear flags follow strong directional moves. After a sharp rally or decline, price consolidates in a tight range that slopes slightly against the prior trend. The flagpole is the initial strong move. The flag is the consolidation. Breakout in the direction of the flagpole resumes the trend.
These patterns work because they represent brief profit-taking or position adjustment after a momentum surge. The underlying trend has not changed. Breakout from the flag typically reaches a measured move equal to the length of the flagpole.
Pennants are similar but form symmetrical triangles instead of parallel channels. Same logic applies. Sharp move, tight consolidation, breakout continuation.
Flags and pennants are most reliable on 1-hour and 4-hour charts during active trading sessions. A flag forming over a weekend in a low-cap altcoin is far less reliable than one forming in Bitcoin during weekday hours.
If the flag drifts longer than two weeks, it loses predictive value. The longer the consolidation, the more likely the pattern will fail or resolve in a neutral move rather than a clean continuation.
Why Patterns Fail: The Specific Traps That Destroy Retail Accounts
Patterns fail in crypto for five specific reasons. First, false breakouts. Price wicks above or below the pattern boundary but the candlestick body does not close beyond it. The move reverses within 1-3 periods. Volume declines during the breakout attempt. These are mechanical failures. No genuine buying or selling pressure supported the move.
Second, low-liquidity traps. Patterns break during weekends, Asian-European transitions, or holidays when order books thin out. A breakout at 3 AM UTC with 20% of normal volume is not reliable. Wait for confirmation during peak hours before acting.
Third, leverage cascades. Crypto markets have massive leveraged positions. When price hits a key level, liquidations trigger. These forced sales or buys push price through pattern boundaries even when no fundamental shift in supply or demand has occurred. The pattern breaks, liquidations resolve, and price snaps back. Retail traders who entered on the initial break are now trapped.
Fourth, news shocks. A regulatory announcement, exchange hack, or macro event overrides any technical setup. Patterns describe trader behavior under normal conditions. When conditions change abruptly, patterns fail.
Fifth, low-cap manipulation. In tokens with thin markets, a single whale can push price through resistance or support. The pattern breaks, retail traders pile in, and the whale exits into their volume. Low-cap tokens under $50 million market cap are especially vulnerable.
The solution is multi-timeframe validation and volume confirmation. A pattern appearing on daily, 4-hour, and 1-hour charts simultaneously has stronger structure than one visible only on a single timeframe. A breakout accompanied by 50-200% above-average volume demonstrates genuine conviction. Patterns with both characteristics achieve 75-85% success rates. Patterns without them fail 50-55% of the time.
Volume Confirmation: The Non-Negotiable Filter
Volume separates real breakouts from noise. When price breaks a pattern boundary on declining volume, the move lacks conviction. Traders are not participating. The breakout will likely fail or stall quickly.
Genuine breakouts show volume surging 50-200% above the 20-period average. This confirms that new participants are entering or exiting positions in size. The move has momentum.
Volume should increase as the pattern forms, not just at the breakout. A triangle that compresses on declining volume, then breaks on a volume spike, is more reliable than one that shows no volume change throughout its formation.
In crypto, volume can be manipulated through wash trading, especially on smaller exchanges. Cross-check volume across multiple exchanges. If Binance shows a volume spike but three other major exchanges do not, the signal is less reliable.
Use volume as a filter, not a standalone signal. A pattern with perfect structure but no volume is not tradeable. A pattern with moderate structure but strong volume is.
Higher Timeframes Win: Why 4-Hour and Daily Charts Matter More
Patterns on 15-minute and 1-hour charts fail more often because they capture noise. A single large trade, a thin order book, or a temporary liquidity gap can create a pattern that looks clean but has no structural meaning.
The 4-hour and daily timeframes filter out that noise. They capture genuine positioning by institutional desks, large holders, and sustained retail interest. A triangle forming over three weeks on the daily chart represents real accumulation or distribution. A triangle forming over six hours on the 15-minute chart might just be lunch-hour chop.
Professional traders use multi-timeframe analysis. They identify the pattern on the daily chart, confirm its structure on the 4-hour chart, and time entry on the 1-hour chart. This approach combines the reliability of higher timeframes with the precision of lower timeframes.
A pattern that agrees with the higher timeframe trend is more reliable than one that contradicts it. An ascending triangle on the 4-hour chart in the middle of a daily uptrend has an 80% breakout rate. The same pattern forming against a daily downtrend has a 50% failure rate.
Risk Management: Why It Matters More Than Pattern Recognition
No pattern works 100% of the time. Even the most reliable setups fail 15-20% of the time. One failed trade without a stop loss can erase the gains from five successful ones.
Position sizing and stop placement matter more than pattern identification. If you risk 2% of your account per trade, you can survive 10 consecutive losses and still have 80% of your capital. If you risk 20% per trade, two losses in a row cut your account in half.
Stops should sit just beyond the pattern boundary. For a breakout above an ascending triangle, place the stop just below the most recent higher low. If price returns to that level, the pattern has failed and you exit. Do not move the stop lower hoping the pattern will work. Accept the loss and wait for the next setup.
Measured moves provide profit targets, but they are not guarantees. If a cup-and-handle projects a 54% gain but price stalls at 30%, take profit. The market does not owe you the textbook target.
Risk management beats pattern recognition every time. A mediocre trader with strict risk controls will outlast a great pattern trader with no stops.
When Patterns Work Best: The Conditions That Improve Reliability
Patterns work best during trending markets. A head-and-shoulders at the top of a multi-month uptrend is far more reliable than one forming in the middle of a range. The trend provides context. The pattern confirms that the trend is exhausting.
Patterns work best in liquid assets. Bitcoin and Ethereum on Binance, Coinbase, or Kraken have deep order books and consistent volume. Patterns in these assets resolve cleanly. Low-cap tokens with $500,000 daily volume produce too many false signals.
Patterns work best during active trading hours. New York and London overlap (1 PM – 5 PM UTC) produces the highest volume and tightest spreads. Patterns forming during these hours are more reliable than those forming overnight.
Patterns work best when they align across timeframes. A daily ascending triangle with a 4-hour ascending triangle inside it, both breaking upward on volume, has an 85% success rate. A 15-minute triangle contradicting a daily downtrend has a 40% success rate.
Use these conditions as filters. Not every pattern is tradeable. The best patterns form in liquid assets, during active hours, on higher timeframes, with volume confirmation, and in alignment with the larger trend. Those setups work 75-85% of the time. Everything else is guesswork.
For a comprehensive visual reference of all major patterns, see the crypto chart patterns cheat sheet with downloadable resources.
The Takeaway
Chart patterns succeed 60-70% of the time when combined with volume confirmation and higher timeframe validation. They fail when traded on low timeframes, in low-liquidity assets, during off-peak hours, or without stops. The pattern itself is rarely the problem. The trader’s execution is. If you trade head-and-shoulders setups on 15-minute charts in altcoins with $2 million market caps during Saturday afternoons, you will lose money. If you trade inverse head-and-shoulders on Bitcoin’s daily chart during weekday sessions with 100%+ volume spikes and a stop just below the right shoulder, you will win 84% of the time. The difference is not the pattern. It’s every other decision you made around it. Risk management, timeframe selection, liquidity assessment, and volume validation determine whether patterns work. Learn those filters before you learn another pattern name.
Frequently Asked Questions
Which crypto chart pattern has the highest success rate?
Inverse head-and-shoulders has an 84% success rate when properly validated with volume confirmation, followed by head-and-shoulders at 82% and double bottoms at 82%. These numbers come from altFINS analyzing thousands of crypto trades across multiple timeframes. Success rates drop to 45-50% without volume confirmation of at least 50% above the 20-period average.
Why do chart patterns fail more often in crypto than traditional markets?
Crypto patterns fail 10-15% more often due to thin liquidity during off-hours, exchange-specific price wicks that trigger stops without genuine market conviction, leveraged position cascades that force liquidations through key levels, 24/7 trading with no closing bell, and lower-cap tokens vulnerable to whale manipulation. Patterns on 4-hour and daily timeframes in liquid assets like Bitcoin and Ethereum achieve reliability comparable to equities.
What is the most important factor for confirming a chart pattern breakout?
Volume confirmation is non-negotiable. Genuine breakouts show volume surging 50-200% above the 20-period average, demonstrating that new participants are entering positions in size. Breakouts on declining volume fail 50-55% of the time because they lack market conviction. Check volume across multiple exchanges to filter out wash trading, especially on smaller platforms.
Do chart patterns work on lower timeframes like 15-minute charts?
Patterns on 15-minute and 1-hour charts produce far more false signals because they capture noise rather than structural positioning. A single large trade or temporary liquidity gap can create a pattern with no real meaning. The 4-hour and daily timeframes filter noise and capture genuine accumulation or distribution by institutional and retail participants over meaningful periods.
How should I place stop losses when trading chart patterns?
Place stops just beyond the pattern boundary. For an ascending triangle breakout, put the stop below the most recent higher low. If price returns to that level, the pattern has failed. Do not move stops lower hoping for recovery. Risk 1-2% of account equity per trade so you can survive 10 consecutive losses with 80%+ capital intact. Position sizing and stop discipline matter more than pattern recognition.
The Weekly Yield Report
You just reviewed eight patterns with documented 60-85% success rates and the five failure modes that invalidate them. Those success rates and failure conditions will shift as market structure evolves.
Every Thursday: where crypto yield actually is – stablecoins, liquid staking and DeFi lending, with the risk named next to the rate and what changed since last week.
Free. No trade calls, no allocations, no hype. Unsubscribe in one
click.
Source link