



AAVE price has climbed toward $184 as Aave’s V4 lending markets passed $1 billion in deposits, putting a key daily resistance level in focus before a possible October move above $200.
Summary
- AAVE price traded near $183 on Binance, with daily resistance at the $183.86 Fibonacci level.
- Aave Labs reported more than $1 billion in V4 deposits and $310 million in active loans.
- The 4-hour chart showed a rising channel, with Supertrend support at $171.66.
- An analyst identified $202.29 as an upside target, conditional on a daily close above $184.
CoinGecko recorded AAVE at approximately $182.51, up about 22.1% over seven days and 35.4% over a month. Its 24-hour trading range stretched from $177.50 to $187.06, placing the token close to the resistance area visible on the Binance daily chart.
Trading volume reached roughly $391.9 million over 24 hours, while AAVE’s market capitalization stood near $2.82 billion, according to the same dataset. Reaching $200 from that price would require an advance of approximately 9.6%.
Aave V4 growth adds context to the rally
Aave Labs reported on Oct. 1 that V4 deposits had crossed $1 billion during September, alongside $310 million in active loans. The update confirmed that V4 had already gone live on Arc and Base.
On Base, the first market is an Equities Hub that accepts seven Coinbase tokenized stocks as collateral, with USDC as the sole borrowable asset. Aave Labs also reported that V3 active loans reached $12.5 billion during September.
The deposit and borrowing figures give the rally a measurable protocol backdrop. However, the move toward $200 also faces a price barrier that AAVE has reached following several weeks of recovery from its summer lows.
For the U.S. connection, Aave said the Coinbase stock tokens are available only to eligible users outside the United States. The products provide exposure to seven U.S. technology companies, including Apple, Microsoft and Nvidia, but their availability does not extend to U.S. investors.
Aave’s Sep. 25 announcement also said the equity tokens are collateral-only at launch. Users can borrow USDC against them, while borrowing the equity tokens themselves is not enabled.
AAVE meets its daily barrier near $184
TradingView’s Binance daily chart placed AAVE at $183.32, up 2.34% for the session, with a high of $187.36 and a low of $177.29. Price was testing the 0.618 Fibonacci level at $183.86, drawn across the larger decline from $386.25 to $58.76.
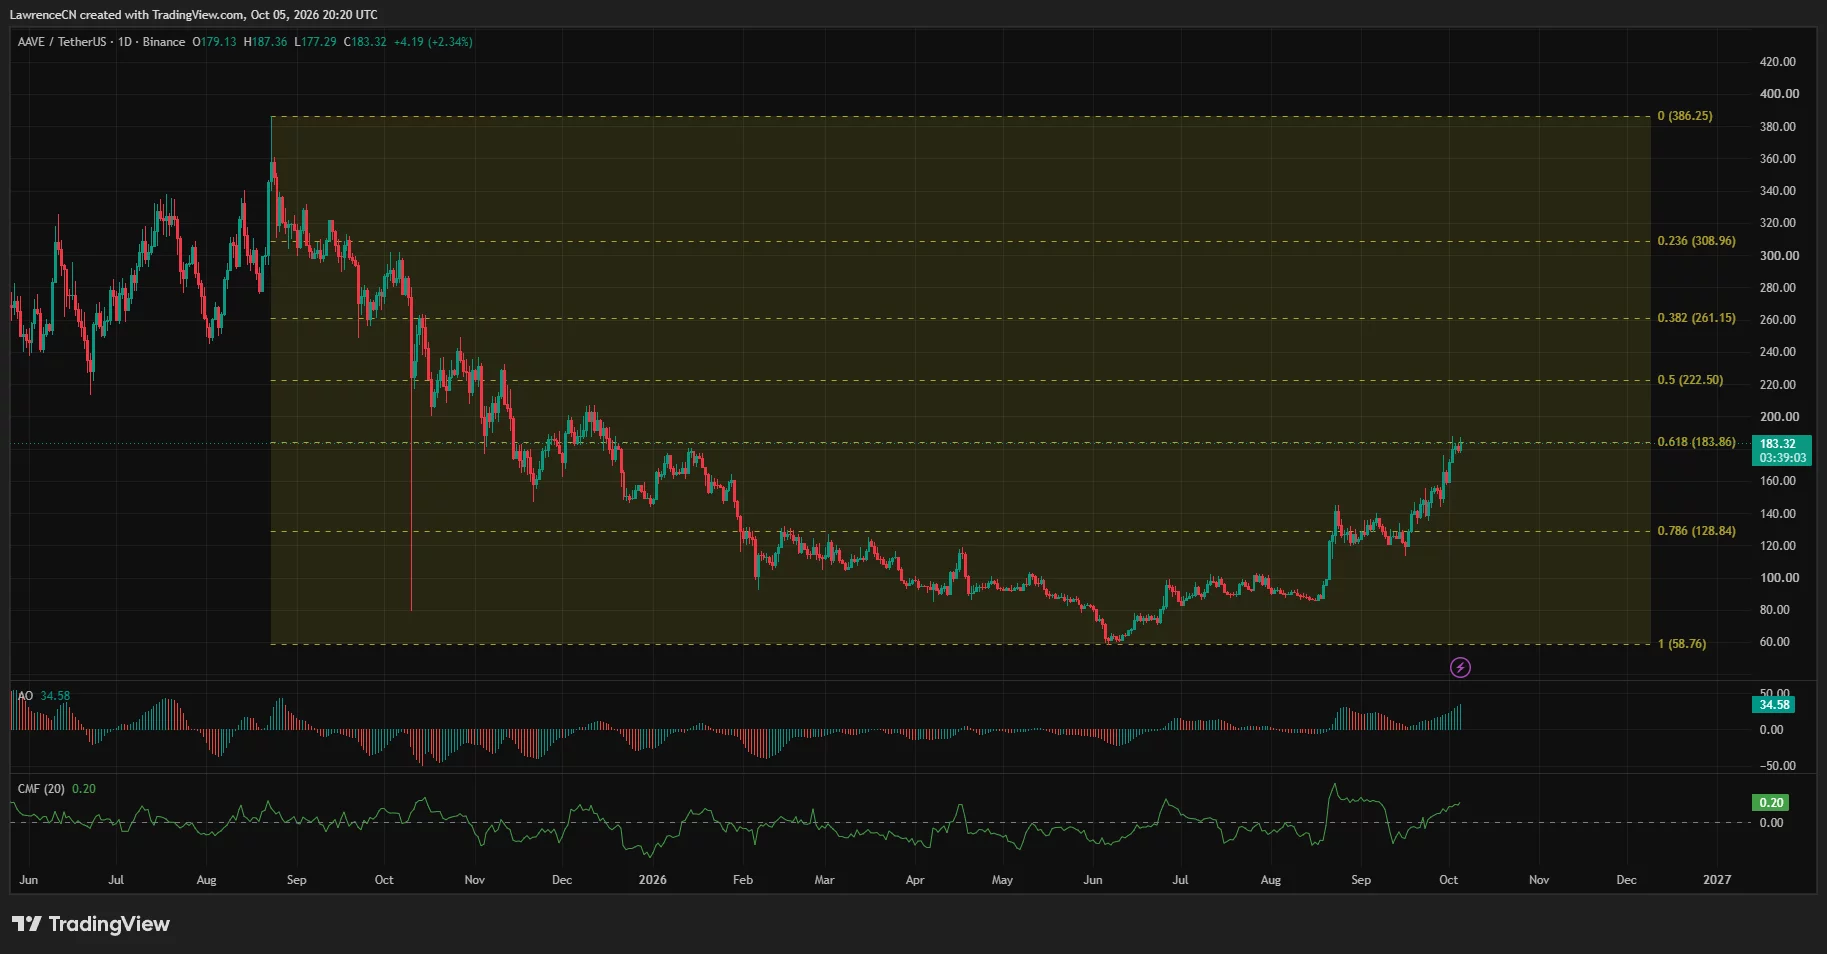
The position of that level makes roughly $184 the immediate test for buyers. Price has traded above it during the session, but the chart still placed AAVE just below the line at the time recorded.
Above the recent $187 area, $200 is the next round-number threshold. The daily Fibonacci framework places the next higher retracement at $222.50, followed by $261.15, although neither level establishes a timetable for reaching it.
Daily momentum remained positive. The Awesome Oscillator read 34.58, with the latest green bars expanding above zero as AAVE approached resistance.
Chaikin Money Flow stood at 0.20, above its zero line. Together, the positive oscillator and money-flow readings support the bullish technical setup, while the $183.86 barrier remains the level price needs to clear.
A rejection around that barrier would leave AAVE trading below a major retracement despite the recovery. The nearer downside levels on the shorter timeframe would then become more relevant than the higher daily Fibonacci targets.
The rising channel puts $171.66 in focus
The Binance 4-hour chart showed AAVE at $183.20 inside an ascending channel extending from mid-September. Successive advances and pullbacks have kept price between the two upward-sloping boundaries.
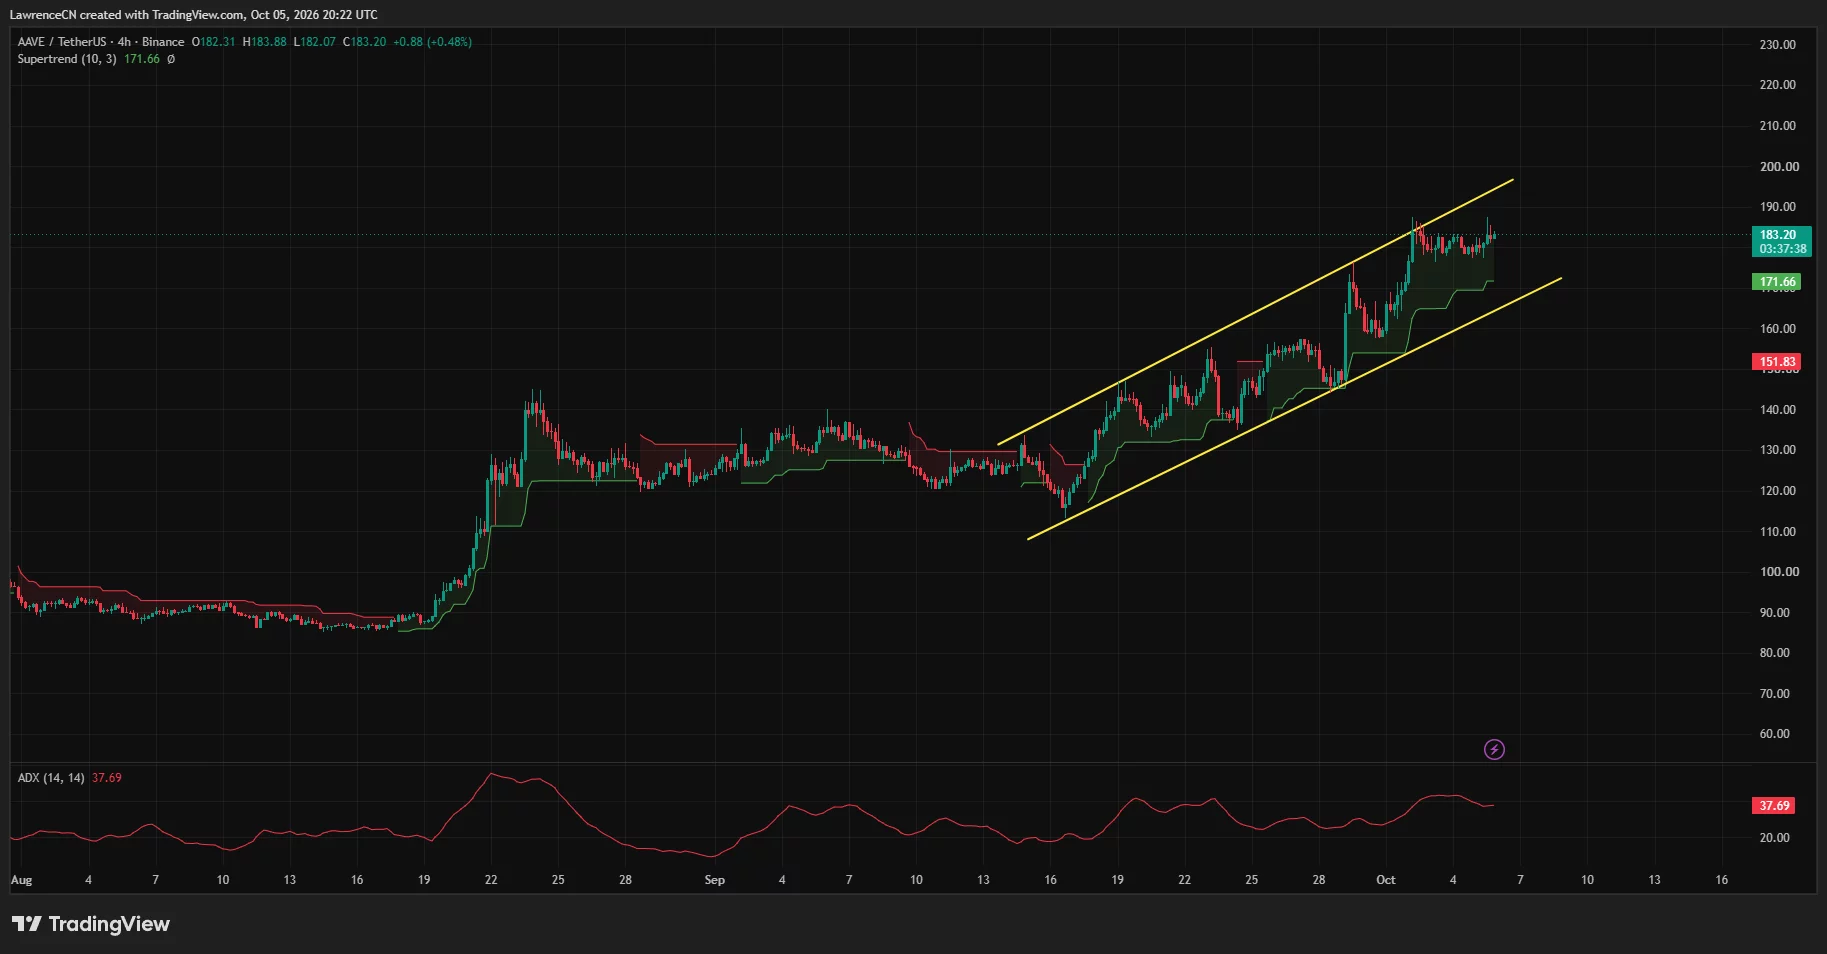
Recent trading was below the upper boundary after the early-October advance toward $187. The channel’s upper edge extends toward the high-$190s farther along the chart, while its lower boundary approaches the $170 area.
The 4-hour Supertrend remained green at $171.66, approximately 6.3% below the displayed price. Holding above that line would preserve its bullish signal; a move below it would weaken the shorter-term setup.
ADX registered 37.69, above the commonly watched 25 threshold associated with a stronger trend. Its latest reading had eased from the recent peak, suggesting that trend strength had cooled even as price remained elevated.
For an October advance, the technical sequence starts with a sustained move through $184–$187, followed by a test of $190 and the upper channel area. Falling through $171.66 and the lower channel boundary would instead expose the earlier trading area around $158–$160.
Liquidity near $186–$189 precedes the $200 target
CoinGlass’s one-week liquidation heatmap showed prominent overhead concentrations around $185–$189, including a bright band near $189. Additional bands appeared toward $190–$193.
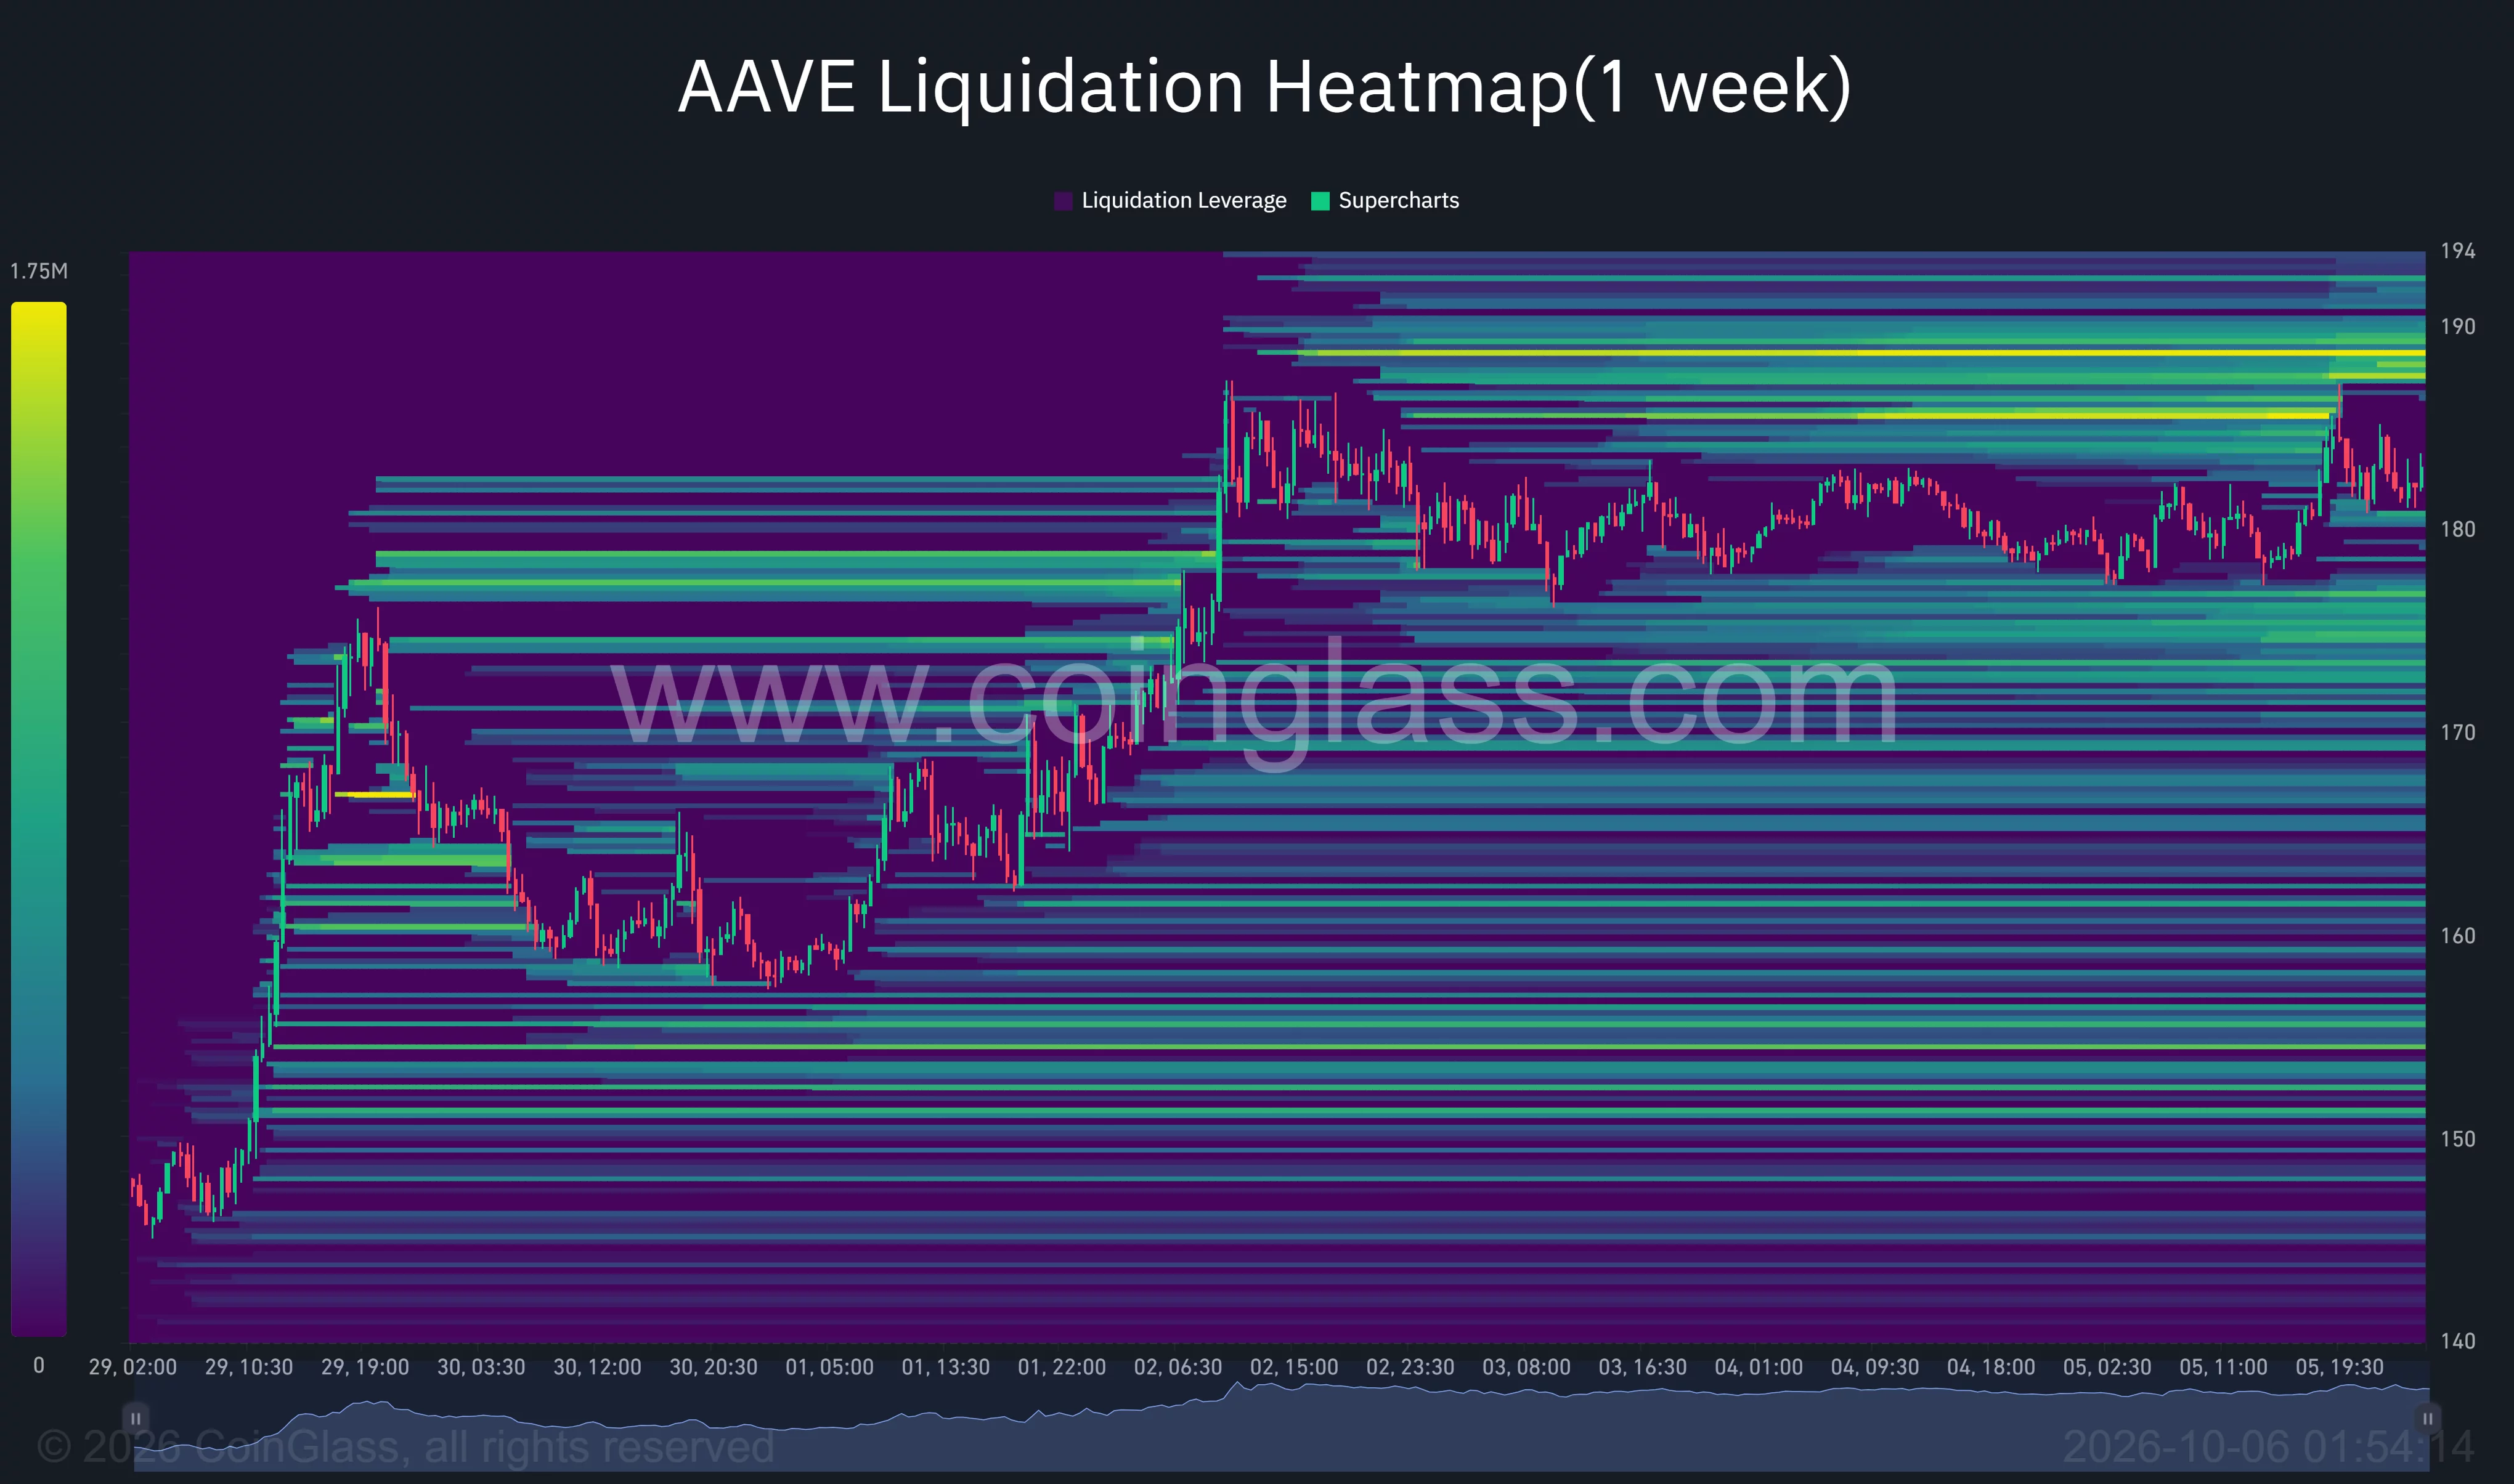
Below price, clusters extended through roughly $174–$177 and $170–$172. A deeper concentration remained near $154–$156, close to the lower portion of the week’s trading range.
The overhead bands place leveraged-position exposure near the same area as recent price resistance. Clearing that zone is the nearer test before a move toward $200.
In an Oct. 5 X post, a pseudonymous analyst identified $202.29 as a potential target after a confident daily close above $184. The analyst also warned that a pullback toward $150–$160 could occur before another advance, citing extended gains and overheated futures.
The bullish October scenario therefore depends first on AAVE establishing support above $184 and clearing the recent highs near $187. Maintaining the rising channel and $171.66 Supertrend support would keep that setup intact, while losing both would shift attention toward the lower support areas.
Disclosure: This article does not represent investment advice. The content and materials featured on this page are for educational purposes only.
Source link