

Dogecoin price remained in a steep downward trend this week as the crypto market dip continued.
Summary
- Dogecoin price has formed a double-bottom pattern at $0.1162 and a neckline at $0.1560.
- Data shows the spot DOGE ETF inflows have waned recently.
- More data shows Dogecoin’s futures open interest has continued falling.
Dogecoin (DOGE) token was trading at $0.1200, down by over 60% from its highest level in September last year.
The main reason for the ongoing weakness in Dogecoin is that the crypto market crash has intensified, as investors focus on other, better-performing assets such as gold and silver.
Additionally, there are signs that demand for the coin has waned in the past few months. Data compiled by SoSoValue shows that the Grayscale, Bitwise, and 21Shares ETFs have not had any inflows in the last two days.
The three funds have added $4 million in assets this month and currently hold $10.9 million, a small amount representing 0.05% of their market capitalization. Additionally, the volume traded on Wednesday was just $170,000.
Dogecoin ETFs have lagged behind other altcoin funds. For example, the spot Chainlink ETFs have had over $73 million in inflows and have $86 million in assets. Spot XRP and Solana have had $1.26 billion in inflows and $884 million in inflows, respectively.
Dogecoin has had no major catalyst in the past few months. In the past, its performance was mostly driven by key narratives like Elon Musk’s tweets and crypto market rally. These narratives have not happened recently.
Meanwhile, the volume and futures open interest has continued falling in the past few weeks. Data compiled by CoinGlass shows that open interest in the futures market dropped to $1.4 billion from the year-to-date high of $2 billion. Also, its volume in the last 24 hours dropped to $1 billion.
Dogecoin price technical analysis
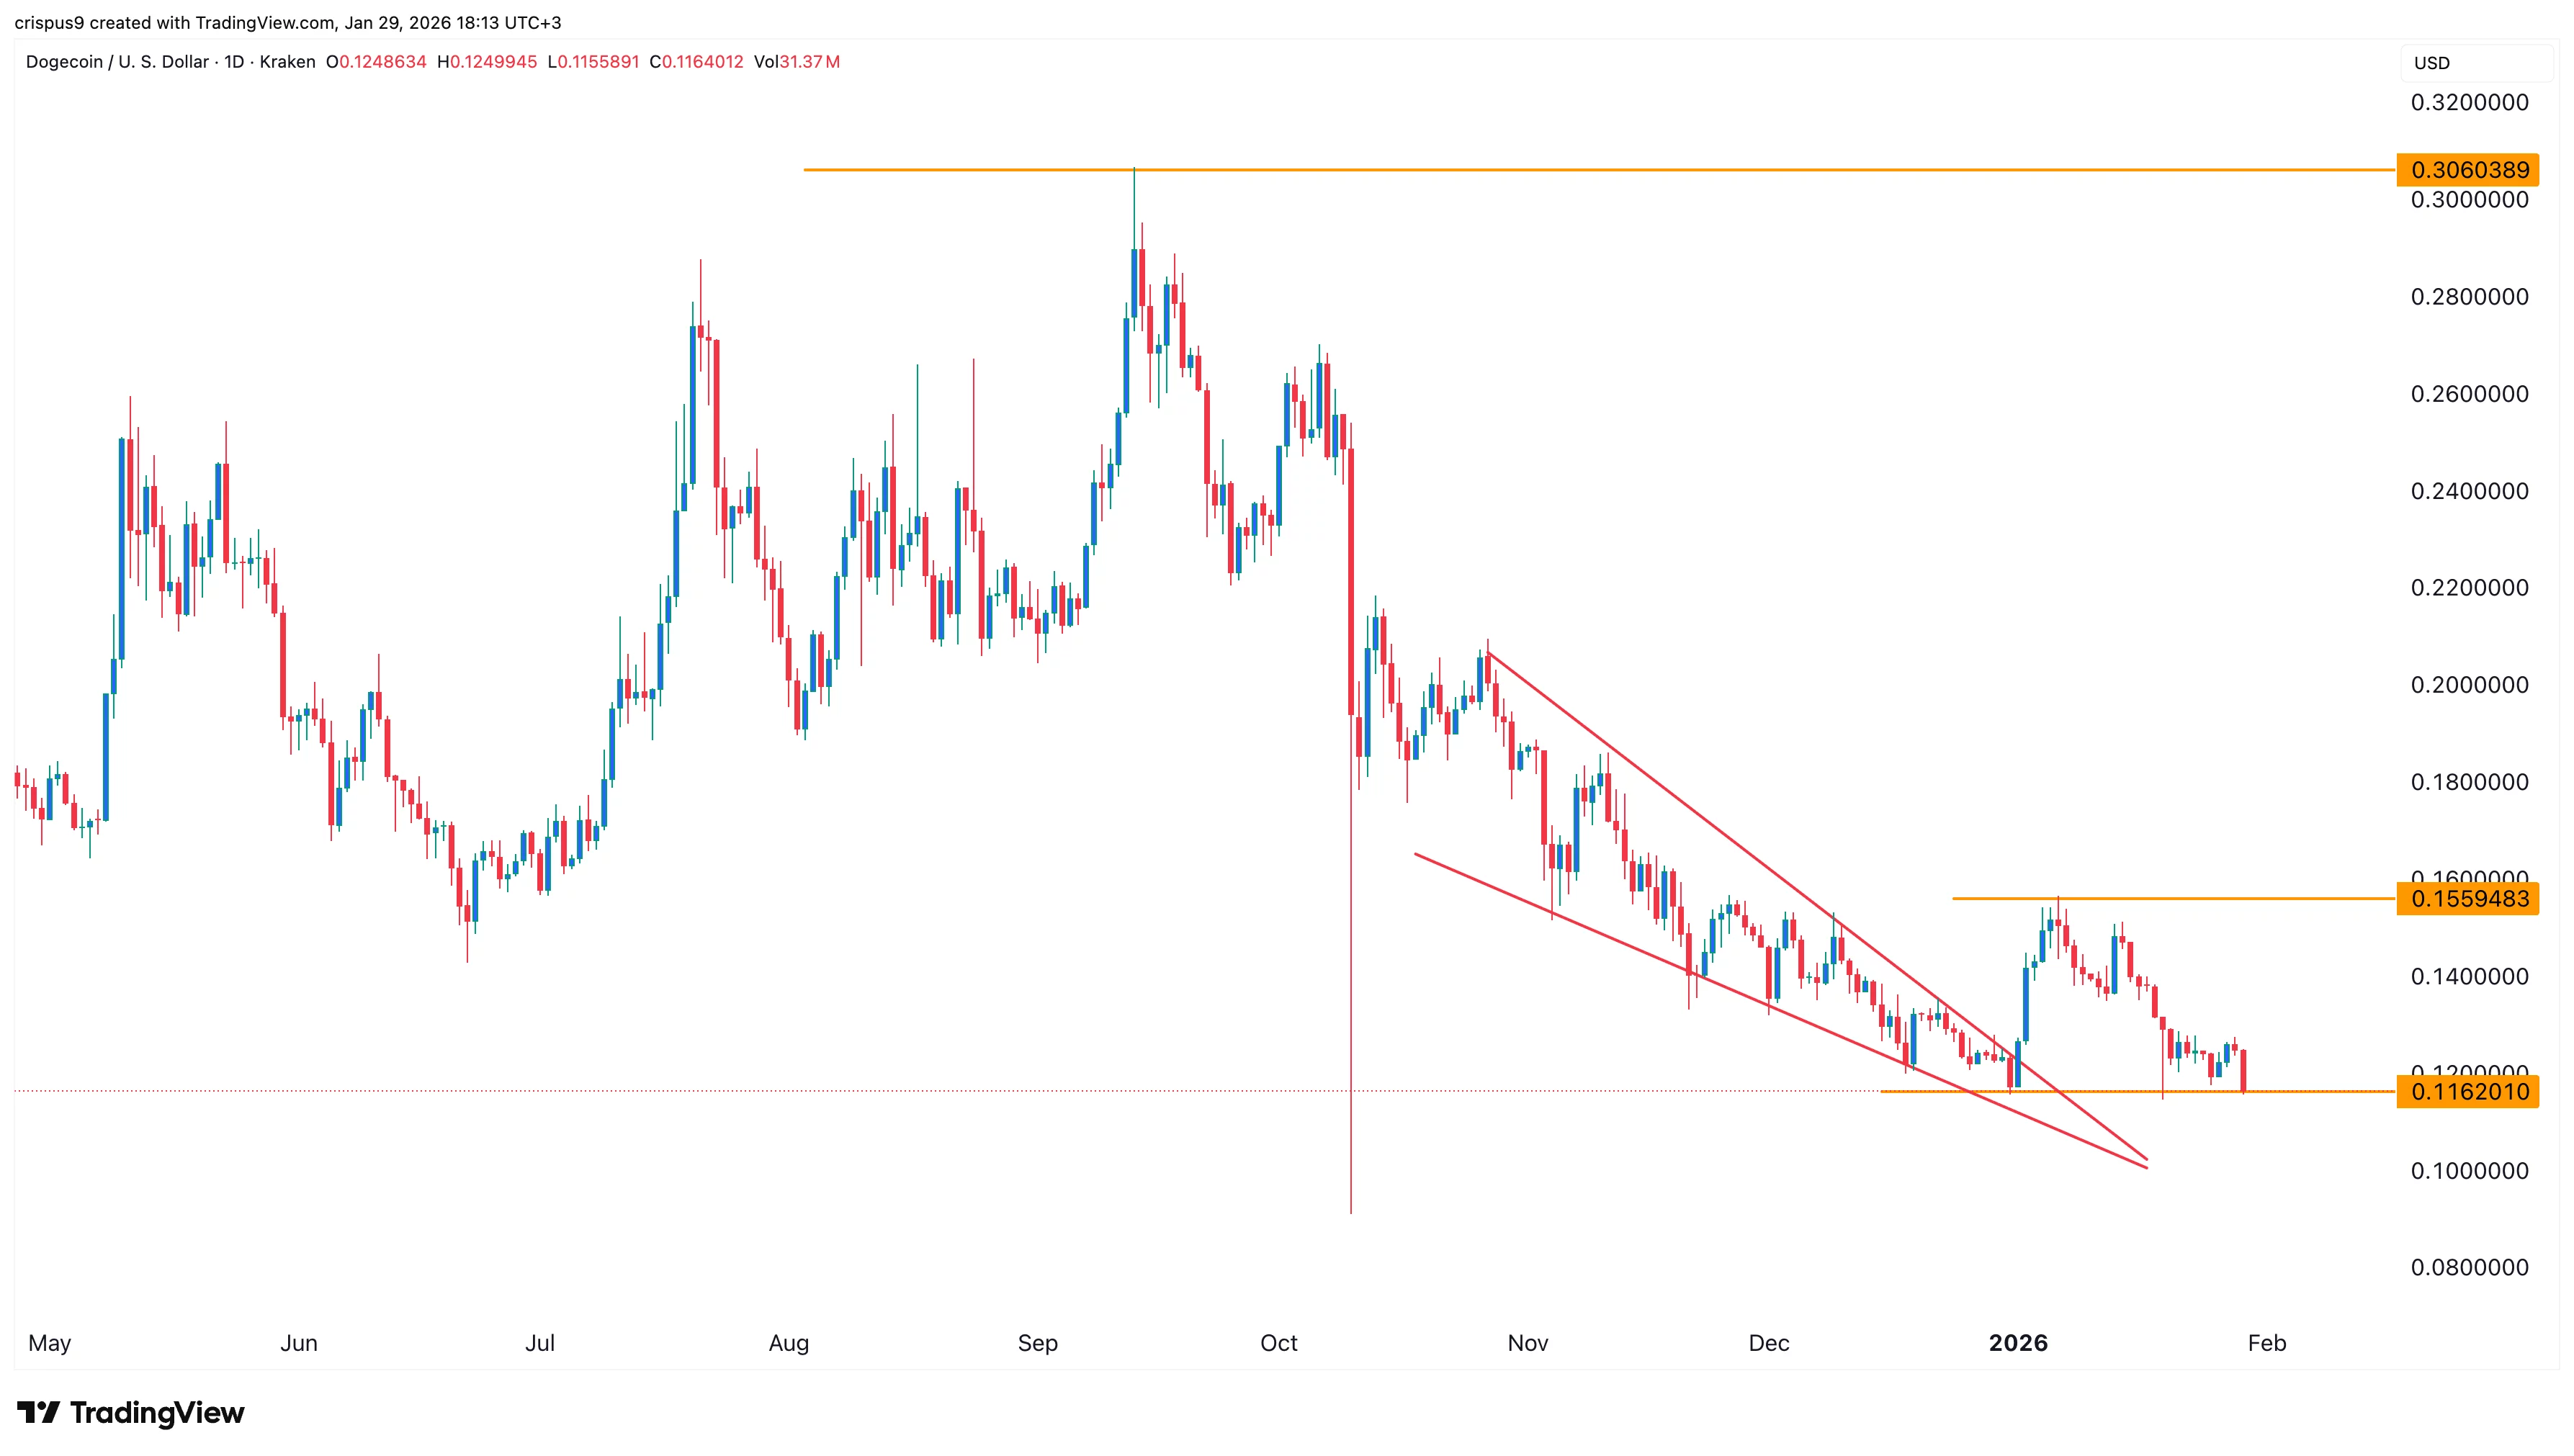
The daily timeframe chart shows that the DOGE price has been in a strong downward trend in the past few months. It dropped from a high of $0.3060 on September 13 to a low of $0.1162.
A closer look shows that the token formed a large falling wedge chart pattern, consisting of two descending, converging trendlines.
The token has formed a double-bottom pattern at $0.1162 and a neckline at $0.1560, its highest level this month.
Therefore, the most likely scenario is where it rebounds as long as it remains above the key support level at $0.1162. A move above that level will signal further gains, potentially to $0.200.
However, a drop below the double-bottom level at $0.1162 will invalidate the bullish outlook and point to more downside, potentially to $0.100.
Source link