

Ethereum price is still above its fair-value zone, holding a strong long-term structure while cooling off from previous highs.
Summary
- Ethereum holds above $3,900 despite slowing volume.
- On-chain data signals healthy consolidation phase.
- Exchange inflows suggest mild short-term selling pressure.
At press time Ethereum was trading at $3,976, up 2.3% in the last 24 hours. In the past week, the asset has fluctuated between $3,709 and $4,080, up 4% but remaining roughly 5% down in the last month. ETH is currently 19% below its all-time high of $4,956, recorded on Aug. 24.
At $33.68 billion, Ethereum’s (ETH) 24-hour trading volume is 15.4% down. This suggests that activity has slowed following a recent period of rapid movement.
Derivatives volume dropped 13.27% to $84.02 billion, according to CoinGlass data, while open interest rose 5.32% to $46.2 billion. This mix often indicates that short-term trading has cooled, while traders continue holding open positions with moderate confidence.
Ethereum price remains strong above fair value
According to an Oct. 23 analysis by CryptoQuant on-chain analyst TeddyVision, Ethereum remains “above fair value but cooling from the top.” Fair value is often represented by the realized price, which is the average cost at which all ETH in circulation was last moved on-chain, essentially reflecting what most holders paid for their coins.
ETH continues to trade above its realized price of around $2,300, which historically has marked the lower bound during fear-driven market phases. A healthy and resilient market structure is indicated by staying above this level.
With an MVRV ratio of 1.67, holders are, on average, 67% in profit. This means the market is profitable but not overheated, and confident, but not euphoric. Price action also pulled back before reaching the upper realized price band near $5,300, indicating a natural consolidation after recent gains rather than a trend reversal.
TeddyVision added that holders seem comfortable keeping their profits while new spot inflows slow down. The next leg higher will likely require fresh liquidity, not leverage-driven buying.
Exchange flows hint at short-term caution
Another CryptoQuant analyst, CryptoOnchain, highlighted a shift in Ethereum’s exchange netflows, from outflows to inflows, hinting at some short-term caution.
The overall exchange netflow has turned from roughly -57,000 ETH to +7,000 ETH over the last week, with Binance accounting for almost half of this shift. The exchange’s 7-day netflow rose from -31,000 ETH to +3,000 ETH, suggesting that some holders are moving ETH to exchanges, possibly to sell.
Although this pattern is not alarming, if it persists, especially when combined with a slowing spot market, it may indicate possible selling pressure.
Ethereum price technical analysis
Ethereum’s technical indicators reflect a neutral stance. The relative strength index at 46.2 indicates balanced momentum, while other oscillators such as the Stochastic, commodity channel index, and average directional index also show a lack of strong directional bias.
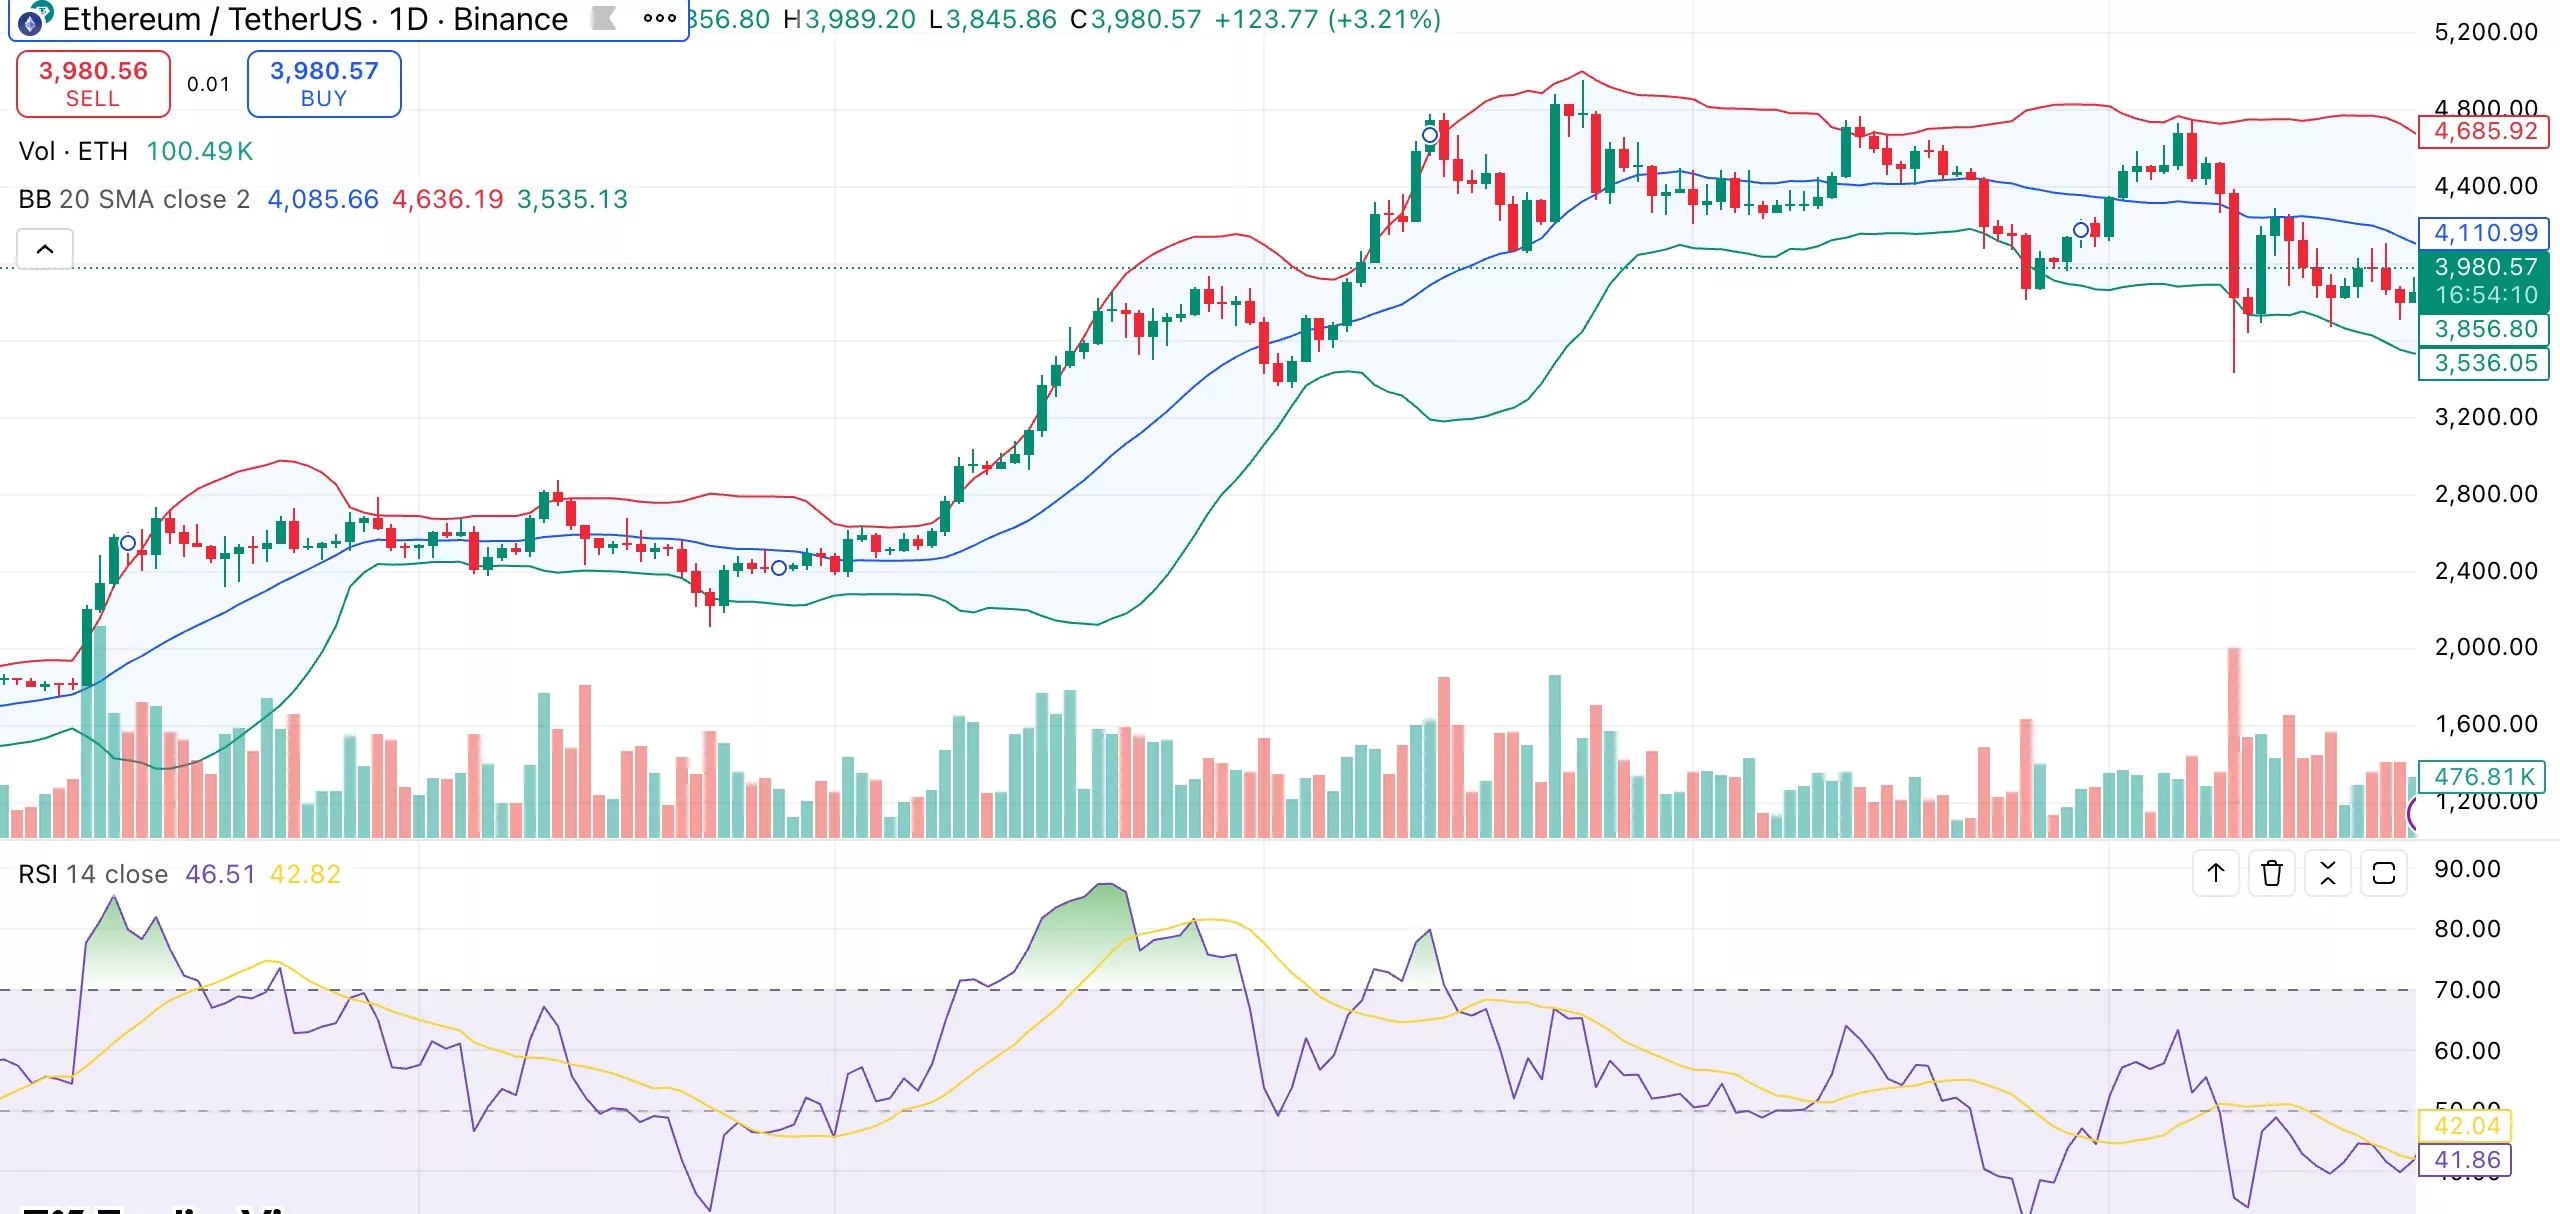
Short-term moving averages (10-day EMA and SMA) are in buy territory near $3,900, showing resilience, but the 20–50-day averages remain bearish, indicating broader consolidation. The 200-day EMA, however, remains well below current prices at $3,577, confirming the long-term uptrend is intact.
The next target could be between $4,500 and $4,800 if ETH maintains its position above $3,900 and breaks above $4,100. If selling pressure increases, a decline below $3,700 might pave the way for a move toward $3,400 or even $3,000.
Source link