


HBAR price remained on edge on Tuesday, August 19, as the crypto market crash continued. Still, its bullish chart pattern and enthusiasm about its role in the real-world asset industry point to a rebound.
Summary
- Hedera Hashgraph token has formed a bullish flag chart pattern on the daily chart.
- The network is betting on the RWA industry to boost its token price.
Hedera (HBAR) price was trading at $0.2330, down by 25% from its highest point on July 27 this year.
Hedera could become a major player in RWA
A potential catalyst for the HBAR price is its role in the RWA industry, which analysts believe will boom in the coming years. A good example of this is its recently announced partnership with Swarm, a platform that offers tokenized assets like bonds and stocks in a regulated manner.
The partnership allows Swarm to leverage Hedera’s technology to offer stocks that are backed 1:1, insolvency-protected, and compatible with decentralized finance.
The collaboration will also unlock more sophisticated financial applications across the Hedera ecosystem, including DAO Treasury management, on-chain lending strategies, and collateralization structures.
Hedera has also ventured into tokenization in other ways. For example, it launched a stablecoin studio that gives users all the tools they need to launch and operate their stablecoins.
Hedera has also announced partnerships with some of the top companies globally that could leverage tokenization in the financial market.
For example, it has a partnership with Aberdeen Group, a British company with over £518 billion in assets under management that could bring some of its assets onchain as Franklin Templeton and BlackRock have done.
HBAR price technical analysis
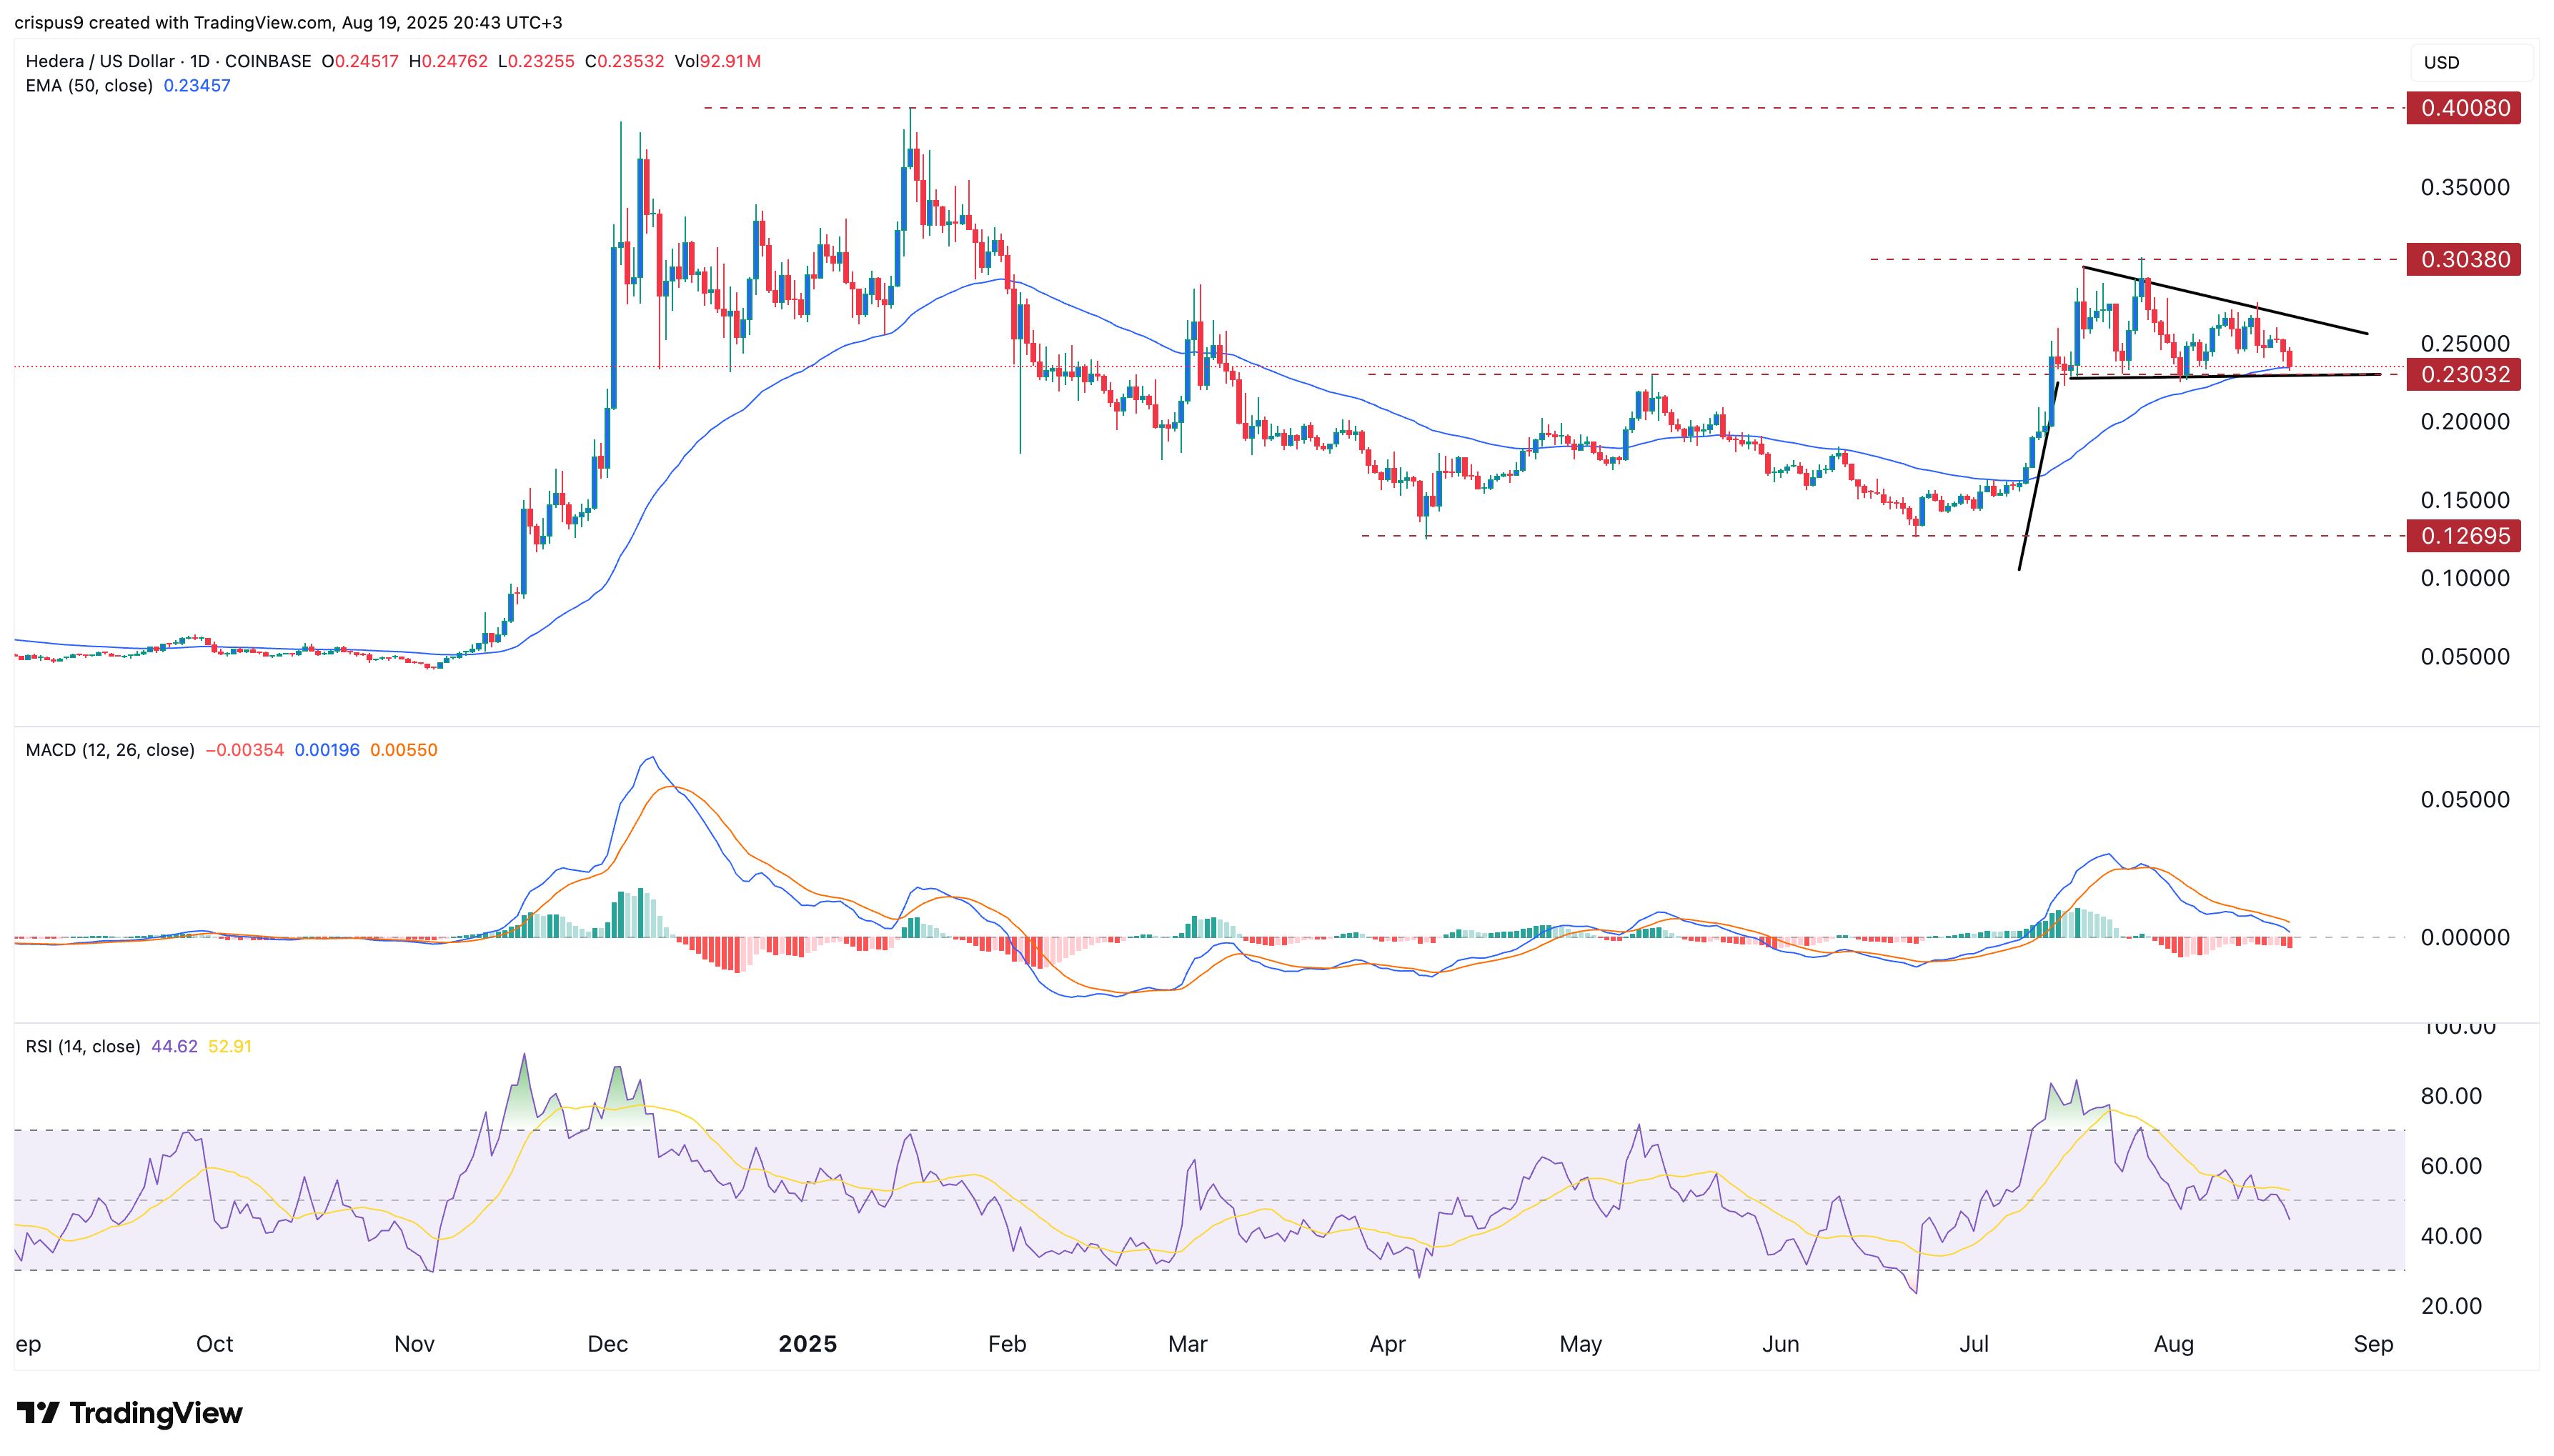
The daily timeframe chart shows that the HBAR price has pulled back and moved into a bear market. It was trading at $0.2300, which aligned with the 50-day moving average.
On the positive side, the coin has formed a bullish flag pattern, which comprises a vertical line and a flag-like pattern.
Hedera has also retested the important support level at $0.2300, which was the neckline of the double-bottom pattern at $0.1270, its lowest levels in May and June. This means that it has formed a break-and-retest pattern.
Therefore, the most likely scenario is that Hedera price rebounds and retests the upper side of the flag at $0.3040. A move above that level will point to more gains to $0.4000, the highest level in January.
Source link