

Bitcoin Breakdown or Break-In Opportunity?
Bitcoin's recent price action has cast a shadow of uncertainty across the cryptocurrency space. A classic rising wedge breakdown has emerged on the charts — often a precursor to bearish sentiment and potential short-term declines. This has led many traders to brace for elevated volatility. However, seasoned crypto investors know that when fear dominates the market, it often presents the most lucrative entry points. While mainstream analysts and social media may shout panic, the contrarian investor is quietly preparing to take action.
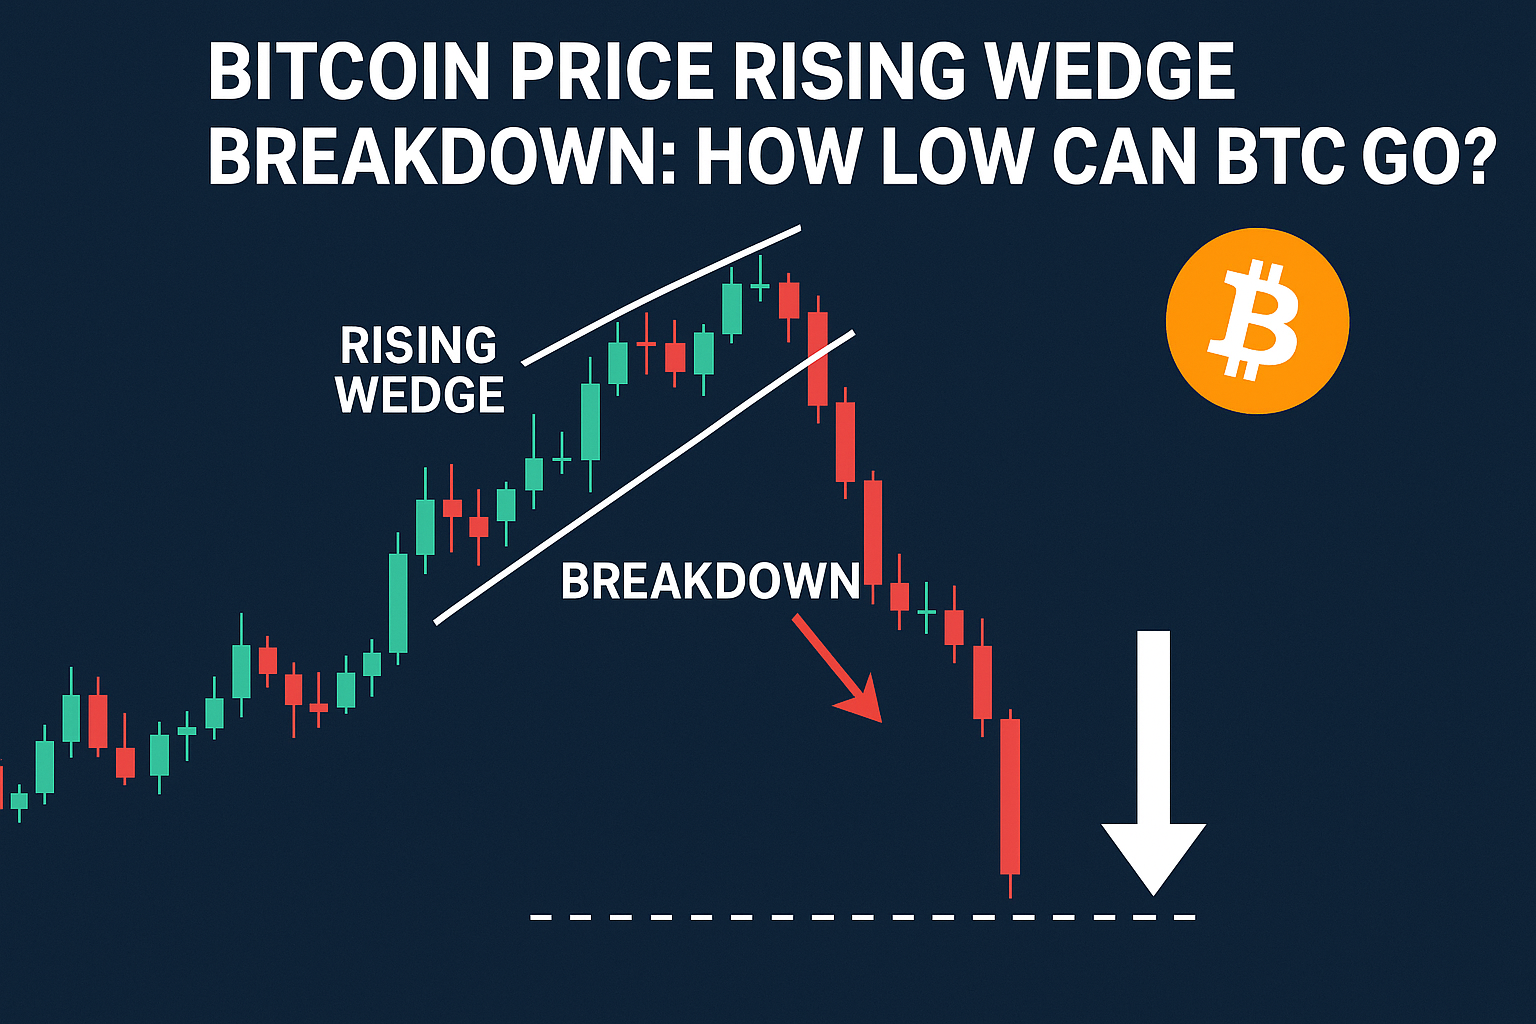
What is a Rising Wedge — and Why Does It Matter?
A rising wedge is a chart pattern characterized by higher highs and higher lows — but with upward momentum losing steam. As the price tightens and support levels become less defined, the eventual outcome is often a sharp breakdown. Bitcoin’s rising wedge, which developed from Q1 2024 through late May, fits this textbook definition. The breakdown from this pattern occurred when BTC breached the lower trendline around $67,000, signaling a shift in short-term sentiment.
Historically, this type of technical formation has been a reliable indicator of retracement — particularly when accompanied by waning trading volume and investor hesitation. In this case, those conditions were clearly present. As Bitcoin fell below critical support, the door opened for sellers to push the price toward the next consolidation zone at $60,000–$62,000 — a range that had previously served as both a launch pad and a psychological threshold for buyers and sellers.
How Far Could Bitcoin Fall?
Technical analysis of the wedge’s breakdown suggests that Bitcoin could retrace further, potentially hovering in the $58,000–$60,000 area in the near term. This might sound alarming at first, especially to new investors or those who entered the market at higher levels. However, price dips like this are part of Bitcoin’s cyclical DNA and should be evaluated in the context of larger trends.
On-chain metrics provide critical insights beyond technical charts. Leading data indicators reveal that as prices dipped, exchange balances — the number of BTC held on centralized trading platforms — continued their downtrend. This suggests that more investors are withdrawing their Bitcoin into cold storage, a sign of growing conviction and a preference for holding rather than selling.
Additionally, long-term holders, often called “diamond hands,” are once again increasing their positions. This group tends to accumulate during drawdowns, recognizing the long-term growth potential rather than reacting to short-term noise. Historical data shows that similar shakeouts often preceded major rallies. For a closer look at Bitcoin’s cyclical patterns, refer to our Bitcoin Bull Market timeline.
The Case for Contrarian Strategy
When the broader market is gripped by fear, seasoned investors take a different view. Following crowd sentiment rarely leads to market-beating returns. Conversely, adopting a contrarian approach — one that challenges the consensus — often uncovers overlooked opportunities. Bitcoin has a well-documented history of aggressive rebounds following pullbacks, particularly in the months following its halving events.
Looking back at post-halving periods in 2016 and 2020, we see a similar script unfold. In both cycles, Bitcoin experienced corrections of 20% or more before rekindling strong bullish momentum. This strength was fueled not by speculative euphoria, but by fundamentals, increased network activity, and renewed institutional interest. The months that followed set the stage for Bitcoin’s meteoric runs.
With the latest halving having occurred in April 2024, Bitcoin is again entering the historically pivotal post-halving phase. If the current wedge breakdown follows the same script, this downturn may not be the end of the bull cycle, but rather the beginning of its next act.
Key Considerations for Strategic Investors
For mid- to long-term participants building or adjusting exposure, the current environment calls for both precision and patience. Rather than fearing short-term price pressure, savvy investors are using this dip to reposition for the months ahead. Here are three critical focal points:
- Accumulation Zones: The $58,000–$62,000 range has historically functioned as a key support zone. Investors accumulating in this area are betting on its reliability — and on the long-term resilience of Bitcoin’s price trajectory.
- BTC Dominance Strength: Bitcoin’s dominance — the percentage of total crypto market cap held by BTC — remains above 50%. This reinforces Bitcoin’s position as the asset of choice for institutions and conservative crypto investors. In previous bull markets, this level of dominance has preceded altcoin cycles, suggesting BTC leads the charge before capital rotates.
- Macro Uptrend Intact: Despite interim corrections, the broader uptrend stretching back to late 2022 remains unbroken. On longer timeframes, BTC continues to print higher highs and higher lows, respecting key Fibonacci retracement levels and confirming a bullish macro structure.
Beyond the Charts: Institutional Pulse
It's also essential to look at the macro and institutional dynamics influencing Bitcoin’s price. The approval of Bitcoin spot ETFs has opened a floodgate of new capital from traditional finance, bringing Bitcoin exposure to retirement accounts and arbitrage desks that were previously sidelined. Since the ETF debut earlier this year, data suggests continuous inflows from both retail and institutional participants.
Moreover, macroeconomic conditions — including rate hikes reaching a plateau and increasing currency devaluation across fiat economies — are creating a favorable backdrop for scarce, decentralized assets like Bitcoin. As sovereign debt concerns intensify globally, Bitcoin is increasingly being considered as a hedge by professional investors and sovereign wealth funds.
Incorporating this fundamental landscape into technical observations provides a more holistic investment thesis. While charts suggest possible weakness in the short term, on-chain trends and macro inputs continue to align bullishly for the rest of 2024 and beyond.
An Opportunity Wrapped in Fear
So, is this Bitcoin breakdown a sign of collapse or a contrarian opportunity in disguise? For the informed investor, the answer leans toward the latter. Every correction paves the way for smart money to step in — often while the crowd exits in panic.
Historical patterns, on-chain metrics, and strong macro fundamentals collectively suggest that Bitcoin’s long-term trajectory remains unshaken. The wedge breakdown may be uncomfortable, but it can also represent a consolidation before expansion — a storm before the calm, and then the surge.
Remember: in trading and investing, risk and opportunity are two sides of the same coin. By applying a calculated, contrarian lens supported by data, investors position themselves to capitalize when sentiment inevitably swings back to optimism.
Conclusion: The Contrarian Playbook
Volatility is not new to Bitcoin — nor is it inherently a bad thing. For those familiar with the asset’s history, temporary dips and technical setbacks often precede explosive rallies. The current wedge breakdown could be precisely the setup many investors are waiting for.
Rather than reacting emotionally, savvy participants are tracking key levels, monitoring on-chain flows, and preparing to accumulate strategically. As always, applying objective analysis — rather than crowd chasing — sets successful investors apart.
Stay informed. Stay flexible. And above all, understand that market dislocations are not just periods of risk, but moments ripe with possibility. To gain more insights about how top investors manage during crashes, read our full guide on Contrarian Investing in Crypto.
Source link